| Author’s note: I have been pushing this article off for a few months. The primary reason was to give myself some time to move my new endeavor (www.FUNDEQ.com) further along and prepare a landing page so I could use this article to generate some traffic and build awareness. I cannot convey the pain and regret I felt having just read this note from Cliff Asness of AQR about his partner’s (Lasse Pedersen) very recent paper addressing this very topic. They stole my thunder! My mind struggles to accept this coincidence of timing; how could we both uncover such similar issues within just months of each other given Sharpe’s original logic was published over a quarter of a century ago? No matter. Stranger things have happened. Kudos to the crew at AQR for continuing to research, educate, and innovate. I just hope my next article will help dampen this pain. While not poking holes in the logic of any Nobel Laureate, I will share another original perspective that is relevant to an investment theme that is currently very popular and gaining traction. |
| Abstract: A popular argument exposing issues with active management was presented by William F. Sharpe in his “The Arithmetic of Active Management” article published in The Financial Analyst’s Journal approximately 25 years ago. Many passive investing advocates have relied on this as unassailable proof active management is a “loser’s game”.
Sharpe assumes one can divide the market into two subsets: one held by passive investors and the other held by active investors. Because both hold shares in the same percentages, they will both ultimately achieve the same “market” returns. However, the higher turnover and trading costs for the active side will lower their net return in aggregate. Some have argued Sharpe’s claims are not valid in practice by challenging his assumptions. In particular, they dispute both the frame of reference within which his argument holds and his definition of passive. We agree and briefly discuss (and extend) these challenges. However, the primary purpose of this article is to put forth new and stronger challenge to his claims without questioning these assumptions. There is a larger hole in Sharpe’s logic that invalidates his conclusions even if we look past the above issues. His argument hinges on the notion that shares held by the passive and active subsets exist in mutually exclusive, closed systems. In other words, passive investors do not trade with active investors. On the surface, this appears to be a fair assumption and his conclusions follow with little more than simple arithmetic. However, this market model is flawed; passive investors may not explicitly trade with active investors, but the companies they own do via issuance and buyback programs. Given the buy-and-hold nature of the passive group, the corporations must be trading with the active managers. This creates an asymmetry in holdings and thus performance between the passive and active sides. We suspect this works out in the favor of active managers. To be fair, buybacks were not nearly as significant a phenomenon when Sharpe originally penned his article. However, given the extraordinary growth of buybacks over the years, the buyback-imposed asymmetry between passive and active investors is bigger than ever. While we believe this further weakens Sharpe’s claims regarding active management necessarily underperforming passive, we are neither condemning passive nor endorsing active management. For example, we acknowledge evidence indicating active returns (net of fees) are lower than their passive counterparts. |
The Original Argument
Readers of this article probably need no reminder regarding Bill Sharpe’s The Arithmetic of Active Management . The beauty of his logic is that it was simple; he needed no numbers, just simple arithmetic.
For years this logic has been used to market lower-cost passive investments and discredit approaches based on active management. Even Jack Bogle leverages this logic in his The Little Book of Common Sense Investing. To be clear, I am a fan of index-based strategies overall (it is so easy to do worse). However, I find few advocates of index investing truly understand that low-fee index funds can have high costs.
Known Flaws in Sharpe’s Logic
Arguments have surfaced over the years challenging Sharpe’s logic. They generally revolve around two related issues. The first is Sharpe’s definition of passive and the second is his frame of reference.
In practice, the definition of passive is not unique. There are many flavors of passive funds. Even those that follow Sharpe’s definition and weight according to market capitalization apply different constraints (e.g., caps on individual stock or sector weights). Moreover, an entirely new class of passive strategies have evolved and taken the label smart beta.
The second challenge comes from the frame of reference. Sharpe’s logic works given one is confined to a particular universe of stocks. However, the investment industry has dissected this universe many different ways (small versus large, value versus growth[1], etc.) and created a variety of sub-indices. The very existence of these products has made it possible for index investors themselves to distort the prices of these sub-universes.
The chart below shows the market capitalization of small, mid, and large capitalization ETFs (iShares and Vanguard) as a percentage of the total market capitalization for each size category. The small capitalization ETFs represent a much larger percentage of their overall market capitalizations. Presumably, the higher ETF coverage relative to the overall small market is a result the Fama and French studies indicating small companies outperform. No matter the reason, investors have clearly used ETFs to pile into small capitalization stocks. This makes it unsurprising that our valuation models indicate small capitalization stocks are significantly more expensive than large capitalizations stocks.
Figure 1: ETF Representation of Small, Mid, and Large as a Percentage of Total Market Capitalization
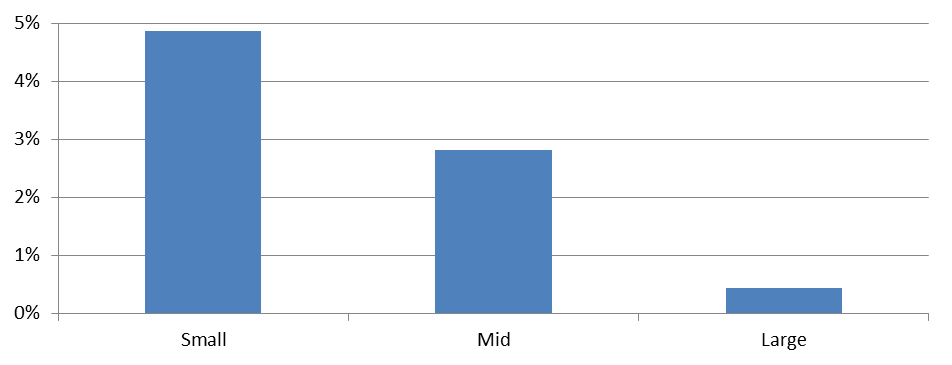
Source: Aaron Brask Capital
More generally, the availability of various factors and other hot items in the ETF format encourages thematic investing and hence bubbles in those sectors. As a result, this commoditization of factor and themes likely creates more alpha for the active side to monetize. Notwithstanding, it is uncertain whether or not an active managers harvest this potential alpha.
Based on this logic, we would caution investors to think (i.e., consider valuations) before diving into some of the recent flavors of the day (e.g., low volatility and dividend payers). In our experience, marketing seemingly trumps quality in the investment industry as product providers cater to advisors and their sales pitches rather than investors and performance.
A New[2] Flaw in Sharpe’s Logic
While we agree with the previously discussed issues above regarding Sharpe’s logic, we are not reiterating those definitional arguments here. In fact, our argument is more general; it refutes Sharpe’s claims while still accepting his definitions for passive as well as his frame of reference. The simple flaw we identify with Sharpe’s logic is that his definition of passive and active investors are not mutually exclusive. Stock buybacks cross this divide.
If passive investors remain passive, the corporates must be transacting with the active investors. This creates an asymmetry in the holdings and thus returns experienced between passive and active investors.
Buybacks tend to be cyclical in nature with corporates buying back the most shares during booms and market peaks while repurchasing the least during market declines and bottoms. As a result, we suspect this asymmetry favors active investors who are taking the other side of the buyback trades. Our back-of-the-envelope calculations[3] indicate this buyback asymmetry could provide somewhere in the neighborhood of 25bps of alpha for the active side. This, of course, is before fees. However, our point here is not to hash out numbers; we are simply exposing what we believe to be a significant hole in Sharpe’s logic.
Figure 2: Buybacks – Crossing the Divide of Passive and Active
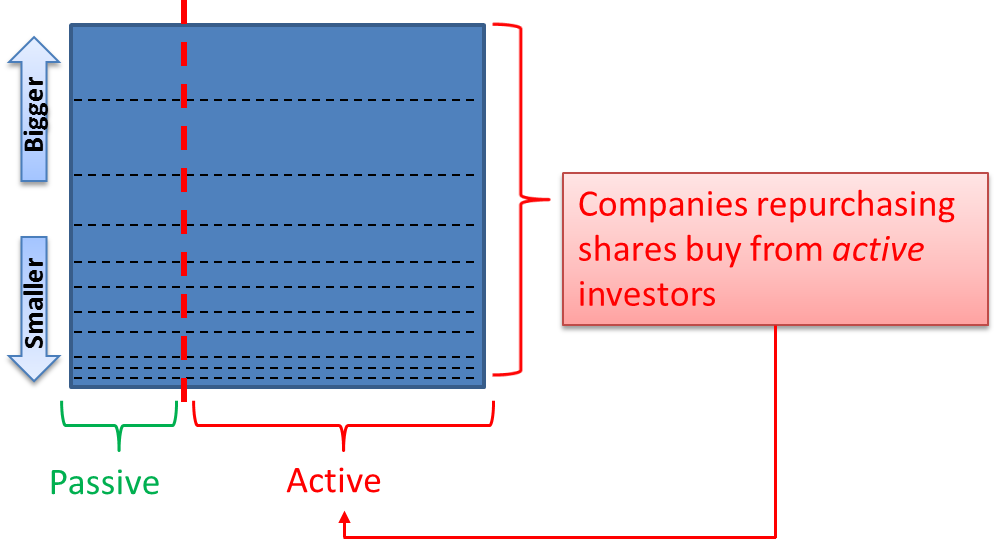
Source: Aaron Brask Capital
Conclusions
Many have refuted Bill Sharpe’s logic regarding the math behind passive and active management. Most have challenged his assumptions and presented empirical evidence. Our argument is more condemning in the sense that it accepts his assumptions and still invalidates his claims.
We suspect the buyback asymmetry we highlighted provides a significant source of alpha for active investors. Does it justify all of the higher fees associated with the active management industry? We suspect not (especially when taxes are taken into account). Theoretical logic aside, the empirical evidence on returns still indicates active managers do not quite earn their keep.
| Note: To be clear, we have immense respect for Sharpe and index investing. We simply find his arguments are not as airtight as many believe. We also note that share buybacks were not nearly as popular in 1991 when Sharpe wrote this article. Without doubt, buybacks have grown far more than, say, dividends since then. For example, S&P 500 dividends increased by a factor of less than four since 1991 but buybacks increased approximately 15-fold. |
About Aaron Brask CapitalMany financial companies make the claim, but our firm is truly different – both in structure and spirit. We are structured as an independent, fee-only registered investment advisor. That means we do not promote any particular products and cannot receive commissions from third parties. In addition to holding us to a fiduciary standard, this structure further removes monetary conflicts of interests and aligns our interests with those of our clients. In terms of spirit, Aaron Brask Capital embodies the ethics, discipline, and expertise of its founder, Aaron Brask. In particular, his analytical background and experience working with some of the most affluent families around the globe have been critical in helping him formulate investment strategies that deliver performance and comfort to his clients. We continually strive to demonstrate our loyalty and value to our clients so they know their financial affairs are being handled with the care and expertise they deserve. |
Disclaimer
|
- We find the definitions of value and growth (as being opposites or mutually exclusive concepts) is one of the most disappointing notions to evolve in the world of investing. We discuss this to some extent in our note Index Investing: Low Fees but High Costs. ↑
- Well, at least I thought it was new until seeing the recent AQR paper. ↑
- We divide up the last six years into three periods. In the first two-year period we estimate $250bn of buybacks while the market was undervalued by say 50%. During the second two-year period we assume markets were fairly valued. During the last two-year period we estimate $1.2tn of buybacks while the market was 50% overvalued. This nets out to about $275bn of alpha asymmetry. That works out to about $46bn or 25bps of alpha per year. ↑