| There has been much discussion of the small cap premium recently. Has its popularity cannibalized its utility? Are large firms preventing a level playing field? Will the small cap premium exist going forward?
This article does not address these concerns directly, but it does identify and analyze another potential issue that could diminish the utility of small cap exposures. In particular, I investigate how stock mispricing and misplacement could impact the performance of size-based indices. |
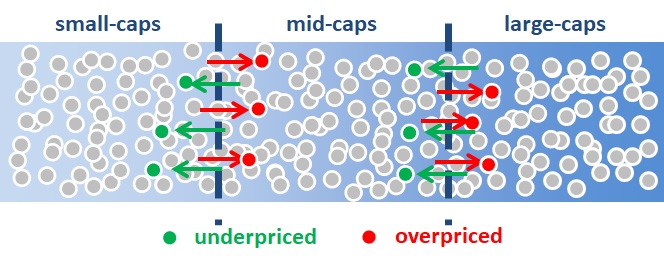
Figure 1: Security Misplacement
Source: Aaron Brask Capital
Overview
I first provide some relevant background information and then I define and discuss the issue of security misplacement. In particular, I highlight potential implications security misplacement has for the performance of portfolios and indices involving small cap (SC) exposures. I then present a simulation model to capture this misplacement phenomenon and quantify its impact.
The Core Issue: Mispricing Causing Misplacement
While I appreciate the behavioral side of finance, I have also pitched a tent in the mispricing camp. I believe there is a certain level of chaos inherent in our markets. Indeed, there are many types of investors with different needs, emotions, models, etc. The inevitable flows from their competing perspectives create occasional if not constant mispricing in many securities. While it might be tempting to believe hedge funds and active market participants instantly jump on these opportunities and keep prices in line, in practice there are limits constraining their ability to do so (constraints on short-selling and a popular J.M. Keynes quote come to mind).
This is not to say one should not question why opportunities exist. Indeed, I have seen many hedge fund blowups due to a lack of sufficient scrutiny of what may have appeared to be obvious opportunities. I simply do not believe opportunities should be ignored if we have some reason to believe they are attractive and do not require more risk or transactional costs (even if we cannot specifically identify the root cause beyond the reasonable assumption that some opportunities are afforded by the general chaos inherent in our capital markets).
Just to be clear, my goal here is not to debate mispricing (it is just background for what follows). There is already much research on this topic and I believe the empirical evidence (e.g., from Alpha Architect and AQR) supports the notion that mispricing exists.
Figure 2: Mispricing versus Efficient Markets Illustration

Source: Aaron Brask Capital
So this leads me to the question ‘So what if mispricing exists?’ Even if we cannot necessarily pinpoint where it is (e.g., identifying specific stocks using bottom-up valuation analysis), understanding potential systematic implications of mispricing may allow investors to protect themselves from negative impacts. For example, let us consider Research Affiliates and their concept of fundamental indexation.
Their basic premise is that a stock portfolio based on market capitalization weighting (MCW) effectively over-weights overpriced stocks and under-weights underpriced stocks. Their solution was to use fundamental weights (i.e., quantities from financial statements instead of market prices). This approach severs the link between the market’s opinion (which could be wrong) on price from the stock weights and their research indicated significant improvement in historical performance using their fundamental weights.
| Note: Cliff Asness of AQR may have mocked the innovation claimed by fundamental indexation advocates (see these humorous slides), but I believe there is something special. Even if fundamental indexation is actually just one type of value investing (I would call it value-light), I believe it fulfills a need on behalf of investors who want market-proportioned portfolios without the mispricing biases. However, if relatively minor value-based adjustments are good, then a larger value-based adjustments might be even better (think QVAL for concentrated value exposure). |
This article highlights another potential negative implication related to stock mispricing. In particular, some stocks will be inadvertently misplaced in different size-based indices or portfolios. For example, consider the companies in a large-cap (LC) index. It is possible some of them are overpriced to the extent they could be placed in the corresponding mid-cap (MC) index if they were fairly valued. Thus, this could bias the LC index with richly valued firms and impose a drag on performance.
Going to the other end of the spectrum, the opposite could be true for small-cap (SC) indices. They might naturally catch some of the underpriced MC stocks and benefit from higher returns (at least over the long term). This raises an interesting question: Is it possible mispricing is partially responsible for the SC premium? This is the motivation for the simulation model and results I present in the next two sections.
| Note: Pure value (i.e., shopping in the valuation trash can) might represent the logical extreme of the mispricing phenomenon highlighted above and has historically provided investors with significantly higher returns than standard market portfolios. |
Simulation Framework
In order to highlight and quantify the impact of security mispricing on size-based exposures, I constructed a Monte-Carlo simulation with the following assumptions:
|
|
I have not specified the actual fundamentals or valuation metrics underlying the model. That would be a slippery slope as one could argue what levels of valuations are appropriate for firms with different growth rates, risks, etc. I have only modeled the existence of mispricing. Of course, the fundamentals of different firms grow at different rates. In fact, one might argue SC firms should grow at higher rates than LC. However, this do not take away from the overall results as my assumption is that mispricing exists regardless of how one accounts for these other details.
Most of the assumptions above are generic but there are two parameters I have chosen the level of volatility for mispricing (20%) and the period over which it is expected to revert (three years). There is nothing magical about these figures; I simply thought they were reasonable estimates. Moreover, the magnitude of turnover they generated in the simulations was on the same order of magnitude as historical levels of turnover realized in existing size-based indices[2]. This observation leads me to believe these assumptions are plausible. However, even if my volatility mispricing estimate of 20% was off, this would only impact the magnitude of the results – not the direction.
There are some interesting dynamics here. For example, more (less) mispricing increases (decreases) the amount of security misplacement and thus impacts performance more (less). This is fairly obvious in the LC (SC) portfolios where the impact is asymmetric and systematically negative (positive). However, it is also true within the MC portfolio. The (positive) impact of mispricing among larger stocks in this portfolio (where MC portfolio captures underpriced stocks from LC while migrating some overpriced stocks to LC) is naturally larger in magnitude than the negative impact of mispricing at the smaller end of the portfolio since the larger securities have larger weights. So the net impact of mispricing and misplacement is positive. Consequently, the net benefit is amplified (attenuated) with more (less) mispricing.
The model above assumes uniformity of mispricing across all sizes. In theory, there should be greater mispricing in SC stocks (e.g., less analyst coverage). This would balance out the impact asymmetry of mispricing on the larger versus smaller stocks – such as in the MC portfolio as discussed above. So I also ran simulations where mispricing was inversely scaled with size. Spoiler: Depending upon how I scale mispricing, the net impact on MC portfolio performance could be positive or negative.
It should be noted this framework does not include micro-caps which could impose the analogous drag around the lower breakpoint for SC portfolios (i.e., I did not allow for companies to fall out of or migrate up into the SC portfolio at the smaller end). However, we can still observe the net impact on the MC portfolio and draw some conclusions about the mispricing dynamics in the context of size-based portfolios. In particular, the impact for the LC portfolio will always be asymmetric and systematically impose a negative performance bias from mispricing and misplacement (regardless of whether mispricing is scaled or not).
| Note: I acknowledge this is not a perfect model. However, I believe it suffices in order to highlight and quantify (not necessarily precisely but at least reasonably) the potential impact of mispricing on size-based indices. As George Box (mathematician / statistician) is quoted saying, “All models are wrong but some are useful.” |
Simulation Results
The simulation results are presented in the table below. It shows the results for the same lognormal distribution of mispricing (20% volatility) across all stocks – SC, MC, and LC (i.e., no scaling) and three scenarios for scaling mispricing inversely with size.
For reference, please note that returns would all be the same (assumed to be 10% here) in a perfectly efficient market simulation (i.e., no mispricing) by construction. Moreover, the total market portfolio in this simulation (all 300 stocks) averages 10% returns as well because the universe is static (i.e., no misplacement from outside the universe – such as micro-caps).
Figure 3: Impact of misplacement with and without scaling mispricing
| Large-cap | Mid-cap | Small-cap | Equal-weight | |
| No scaling | 9.8% | 10.8% | 12.5% | 11.3% |
| With scaling (10-30%) | 9.8% | 9.9% | 13.5% | 11.4% |
| With scaling (10-40%) | 9.8% | 9.4% | 15.0% | 12.1% |
| With scaling (20-40%) | 9.6% | 10.6% | 16.6% | 13.1% |
Source: Aaron Brask Capital
As expected (by construction), LC performance fell short of the 10% market average in all of the simulations. However, the underperformance was marginal at around 20-40bps. As discussed above, this is due to it absorbing some overpriced stocks from and losing underpriced to the MC portfolio. On the other hand, the equal-weight (EW) portfolio outperformed in all instances and its outperformance increased as the overall level of mispricing increased (from the top of the table to bottom).
| Note: At first, I thought the outperformance of the equal-weight over LC portfolios were too low. Indeed, Research Affiliates found that MCW imposed a performance drag of approximately 2%. However, I then realized I cannot compare the results directly to fundamental indexation because the simulation here only captures mispricing around the breakpoints – not across the entire portfolio. |
It is also worth noting the impact of scaling on the MC portfolio. Depending upon the scaling scenario, MC performance was either better or worse than the overall market. In cases where the relative scaling varied the most (from 10-30% or 3x and from 10-40% or 4x), the negative impact stemming from the lower breakpoint (absorbing overpriced from and losing underpriced to the SC portfolio) outweighed the benefit at the upper breakpoint with the LC portfolio. So the MC portfolio underperformed LC with the higher breadth of mispricing scaling but outperformed when scaling was less extreme.
The simulation was setup such that the SC portfolio did not suffer from these negatives issues associated with a lower breakpoint (i.e., assumed no micro-caps). So the significantly higher returns experienced by the SC portfolios should be taken with a grain of salt. In reality, the SC portfolio would have a lower breakpoint and it would impose a drag on performance. However, this does bring up another interesting consideration.
Another Interesting Result
Given our assumption that mispricing is lognormally distributed (which I think is reasonable), there is another factor that will determine the amount of performance impact from misplacement. In particular, the distribution of market capitalizations for the firms in the universe will be a significant determinant for how much misplacement occurs around breakpoints. Indeed, if the sizes of the firms around breakpoints are tightly clustered, then mispricing will be more likely to create misplacement. If the sizes are more spread out, then mispricing will be less likely to help firms leapfrog across breakpoints.
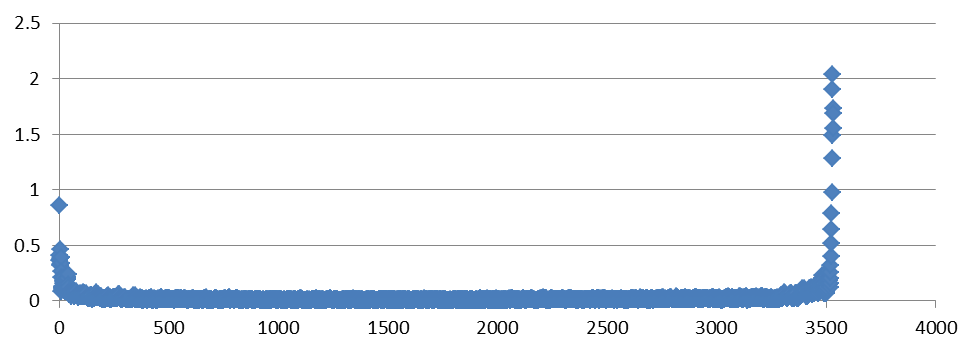
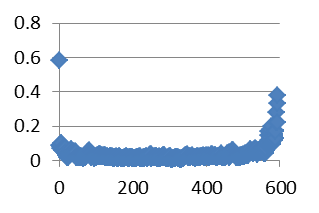
This prompted me to investigate the distribution of (free-float adjusted) market capitalizations. The results I came up with are very interesting. I took the size of each company and divided it by the average size of the next 10 largest companies (then subtracted one). I then plotted the results across all companies in the iShares Total Market ETF. Interestingly, the shape was a smile. This indicates the largest and smallest firms were spread out (higher ratios) whereas many of the companies in the middle were closer together (on a percentage basis).
Figure 4: Dispersion of firm sizes across total market portfolio (free-float adjusted)
Source: Aaron Brask Capital
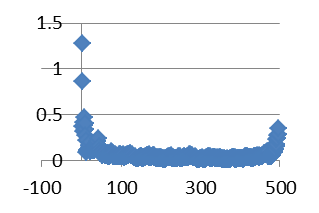
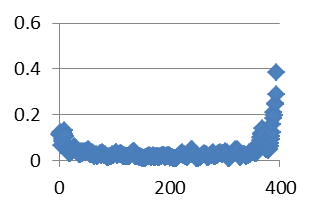
Curiosity got the best of me and I conducted the same analysis on the companies within the small, mid, and large iShares ETFs portfolios. This is where it gets more interesting. Each of these portfolios exhibited a similar smile-shaped output – again indicating the smallest and largest companies within each portfolio were more spread out. But wait! The distribution within the total market portfolio was not spread out except at the ends. So how could this be? If I were to tape these three distributions (for SC, MC, and LC) together, then I would have expected it to resemble the total market distribution as one big smile. However, that was not the case (there were three mini-smiles). It got me to thinking and I came up with two possible answers.
First, it is possible these mini-smiles are just the result of market volatility. Once an index rebalances, then the prices and hence market capitalizations will move around. This could cause more size disparity around the breakpoints.
The second idea that came to mind involves index rules. In particular, many index providers employ buffers around index breakpoints in order to mitigate unnecessary turnover. This could also keep some stocks from migrating across breakpoints and would also result in more size disparity near the breakpoints.
Figure 5: Dispersion of firm sizes across small, mid, and large portfolios (free-float adjusted)
| Large-cap
|
Mid-cap
|
Small-cap
|
Source: Aaron Brask Capital
Conclusions
My results were generated by a Monte-Carlo simulation and do not precisely capture all the dynamics (or real history) of our stock markets. However, I believe this is a fair market model for the purposes of illustrating the existence of mispricing impact.
Truth be told, the magnitude of my results were not as strong as I suspected before I conducted the analysis. In light of the minimal impact on the LC portfolio (20-40bps) and the variable impact on MC portfolios (teetering between positive and negative depending upon the scaling scenario), I am not convinced that mispricing and misplacement make up any significant portion of the SC premium. At the same time, I am pleased to have uncovered the interesting smile phenomenon around index breakpoints which warrants further consideration.
About Aaron Brask CapitalMany financial companies make the claim, but our firm is truly different – both in structure and spirit. We are structured as an independent, fee-only registered investment advisor. That means we do not promote any particular products and cannot receive commissions from third parties. In addition to holding us to a fiduciary standard, this structure further removes monetary conflicts of interests and aligns our interests with those of our clients. In terms of spirit, Aaron Brask Capital embodies the ethics, discipline, and expertise of its founder, Aaron Brask. In particular, his analytical background and experience working with some of the most affluent families around the globe have been critical in helping him formulate investment strategies that deliver performance and comfort to his clients. We continually strive to demonstrate our loyalty and value to our clients so they know their financial affairs are being handled with the care and expertise they deserve. |
Disclaimer
|