“A goal without a plan is just a wish.” – Antoine de Saint-Exupery
“Know what you own and know why you own it.” – Peter Lynch
| Financial planning is a process whereby one attempts to determine how their assets will cover their liabilities (e.g., retirement). There are many interrelated moving parts within the financial planning process, so we first identify three primary components: assets, liabilities, and the investments linking them together. We believe this decomposition facilitates a better understanding of the overall process and provides a better perspective for our discussion and evaluation of related products, strategies, and concepts.
We first discuss two popular products and strategies for retirement planning: annuities and the safe withdrawal rate (SWR). We then present our own structured investment income (SII) strategy which is effectively a hybrid approach. We highlight the benefits of each strategy and weigh them against potential costs and risks. Our SII approach extracts the primary advantages of annuity and SWR strategies (reliable income, liquidity, and capital growth) while addressing two of their major drawbacks (costs and market dependency). We isolate the key benefit of annuities (longevity insurance) to create a reliable income stream and then complement it with additional income from an investment portfolio. This provides further protection against inflation risk while targeting higher capital growth by transferring risk away from the income and concentrating it in the investment portfolio where it can be rewarded with higher expected return. Relying on the dividends and interest but not the principal removes market dependency. Moreover, it allows the investment capital to grow unfettered in the background. Relative to annuity products and statistical SWR approaches, we believe SII provides a safer, simpler, and more transparent alternative for financial planning and retirement strategies. |
Figure 1: Structured Investment Income (SII) Reduces Market Dependence
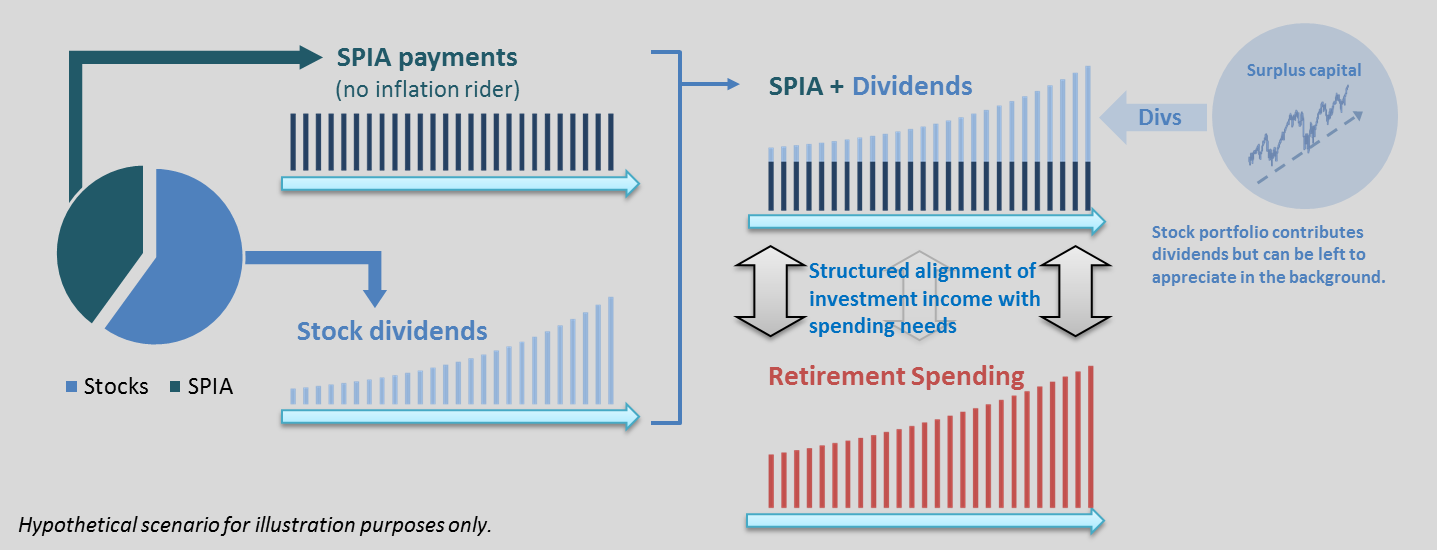
Source: Aaron Brask Capital
Financial Planning: Three Primary Components
| Disclaimer: This article is not intended to be a comprehensive treatise on financial planning. Our goal in writing this article is to present an alternative approach to retirement planning that structures one’s portfolio income rather than its assets. We believe this approach provides several benefits over the more popular traditional strategies marketed by most firms. |
Many investors and retirees are intimidated by the financial planning process. While there can be many small details requiring attention, the overall process need not be as complex as many assume. In the following sections, we decompose financial planning into three primary components: assets, liabilities, and the investments used to link them together. We focus on retirement planning although the concepts and strategies may be applied more generally.
Our goal is to provide a broader perspective and help investors attain a better understanding of the process. Whether one chooses a do-it-yourself approach or engages the help of an investment professional, we hope our perspective makes their financial planning process more efficient and robust.
It is worth noting both the importance of engaging a professional for financial planning as well as the risks associated with doing so. For example, we cannot understate the importance of making objective and conservative assumptions in order to minimize risks within a financial plan. For example, misplaced optimism or aggressive assumptions can result in premature depletion of one’s retirement assets – most certainly a catastrophic situation. This is one area where an experienced and objective financial planner can provide immense value.
It is also important to understand what type of investment professional one chooses to work with as it determines the standard of care they are required to uphold. Moreover, their affiliations and compensation structure may impact their advice. Despite the seemingly endless array of labels, there are really just three primary classifications for licensed investment professionals: investment advisors, securities brokers, and insurance agents. Please feel free to contact us or visit our website to learn more about how these classifications may impact the advice you receive.
| Note: This article focuses on financial planning from an investment angle. Tax and estate matters should always be considered. However, they are beyond the scope of our discussion here and should be tended to by professionals with the appropriate expertise (e.g., CPAs and estate planning attorneys). |
Defining Assets
The first component of the financial planning process we highlight is defining the assets. Many advisors offer lists to help clients identify what assets they possess. We believe it is important to classify assets according to their context within a financial plan. In particular, we define an asset as anything that will likely contribute positive cash flows to the financial plan.
For example, consider the case where one owns their home free and clear (i.e., no mortgage) but they plan to remain there and eventually bequeath it to their children or other heirs. In this case, the house is technically an asset by most standards but serves more as a liability for planning purposes because it will require expenses such as taxes, maintenance, etc. Notwithstanding, there are cases where one might leverage the equity in their home by taking out a mortgage or reverse mortgage.
Of course, assets need not be tangible. If one still works or plans on working, their job or career, accumulated Social Security, pensions, and other retirement assets are all assets. Savings, investments, and other assets can potentially be used to contribute to a financial plan.
| Note: It is important to realize our view of assets can vary significantly from what others identify as assets. An estate planning attorney would most certainly consider the house in the above example as an asset of the estate. |
Defining Liabilities
The second component of the financial planning process involves the liabilities. Following our definition of an asset, we define a liability as anything in a financial plan that will likely involve negative cash flows.
Individuals and professional planners often focus on replacement of income as the primary liability. We believe this approach does not allow for sufficient granularity in defining liabilities as it effectively assumes equal importance across liabilities. For example, this perspective makes one’s monthly spa and salon visits indistinguishable from the grocery or electric bills. In reality, there is some natural order for prioritization spending. Replacing income may also ignore spending asymmetries associated with retirement or aging (e.g., more leisure time immediately after retirement versus less or less extensive travel later on).
While we do not advocate earmarking one’s Coca Cola dividends to specific expenses, we believe liabilities should, at least, be classified as discretionary and non-discretionary. Depending upon client preference or need, one could prioritize the remainder of discretionary items based on varying levels of necessity. Prioritizing in this way can be instructive when considering the types of income used to cover different liabilities.
This notion whereby one defines their liabilities more granularly is part of a relatively new and evolving topic known as liability-driven planning or liability-driven investing (note: the word liability is sometimes replaced with objectives). One key distinguishing feature of these approaches is the focus directly on minimizing risk relative to the liabilities (or objectives) versus, say, portfolio risk (e.g., volatility).
Another dimension of liabilities that must be considered is inflation. That is, the costs of many budget items are likely to increase through time. It is worth noting no two people experience the same inflation because they consume different things. Expenses related to housing, medical, education (e.g., grandchildren), and lifestyle choices (e.g., avid traveler or boater) all experience varying degrees of inflation.
There are also many types of known and unknown liabilities. Directly insuring against some events and using umbrella policies can help minimize the adverse effects these uncertainties may have on a financial plan. Of course, the costs of insurance and self-insuring should be considered. However, situations will inevitably arise and give rise to unanticipated expenses. Setting aside and maintaining a cash reserve is another important factor for managing these potential liabilities.
Investments
The third and last component of the financial planning process relates to the investments used to link assets and liabilities. While some advisors invest in many different asset classes, we confine our discussion here to three primary types of investments: stocks, bonds, and annuities. We do this for two reasons. The first is to keep things simple and avoid distracting readers from the core discussion around financial planning. The second reason is we view investments in other asset classes with a great degree of skepticism and default to avoiding them in general. The table below provides a brief overview of the key asset classes and some of the key features we associate with them.
Figure 2: Overview of Asset Classes
| Asset Class | Key Features |
| Stocks | Stocks generally follow fundamentals higher over the long term but prices can be very volatile. Importantly, stocks can provide inflation protection to shareholders via maintaining steady returns on their assets (which are subject to inflation). |
| Bonds | Bonds prices move in response to interest rates but are typically less volatile than stocks. Longer term bonds are generally more volatile than shorter term bonds. Standard bonds do not protect against inflation. |
| Annuities | Annuities are the only products that can guarantee lifelong income. We typically only use basic annuities as we find fees and embedded costs are too high in more complicated products. |
| Real Estate | Real estate is often an investor favorite as it represents a tangible, productive investment many can understand. It also protects, to a degree, against inflation. We find investors are often already sufficiently exposed to real estate both directly via personal properties and indirectly via companies in their stock portfolios. Fees and embedded leverage should be considered when investing in real estate investment trusts and other vehicles. |
| Commodities | Commodities are often touted as a direct hedge for inflation hedge. While true, we view them as very volatile, negative-carry[1] assets. Moreover, we find many investors already have exposure to commodities indirectly via their stock portfolios. |
| Alternative Investments (e.g., hedge funds, private equity, venture capital) | We view most alternative assets as illiquid, costly, and often unnecessary. These products typically rely on manager skill or advanced strategies (instead of the fundamentals of the underlying assets’) to generate returns and thus require expert due diligence. |
Source: Aaron Brask Capital
There are many types of investment strategies (both active and passive) within each asset class. In this article we generally assume stock and bond investments are passively managed with minimal turnover and will generate market returns. To be clear, we do acknowledge the ability of managers or smarter indices to outperform the broad market indices (i.e., generate alpha) and alter performance profiles. More information on that topic can be found in our article Index Investing: Low Fees but High Costs.
Three Financial Planning Strategies
Now that we have discussed the three primary components of the financial planning process, we will examine three retirement strategies: annuities, safe withdrawal rates (SWRs), and structured investment income. To be sure, we view these strategies as effectively converting assets into investments so that they sensibly cover one’s liabilities.
The first strategy relies on annuity contracts sold by insurance companies. Accordingly, this is more of a product than a strategy. The second strategy uses statistical simulations to estimate safe withdrawal rates (SWRs). That is, they attempt to figure out how much of a portfolio one can extract each year (i.e., synthetic income) without prematurely depleting the principal. The third structured investment income strategy is our proprietary approach. It effectively blends ingredients from the first two strategies in a way that we believe creates several benefits.
Annuities
| Note: While we do not go into the details here, we have provided a brief overview of popular annuity contracts and features in the appendix. |
Annuities are one of the most popular financial products out there. We believe this is partly due to their unique ability to provide longevity insurance (e.g., guarantee income for one’s lifetime). Indeed, this is a valuable service only insurance companies can provide. However, we suspect the hefty commissions (approximately 1-10% of the invested value) brokers can earn may be a larger factor driving the popularity of annuities. We are generally skeptical of the more complex products that tend to have higher fees (and thus highest commissions for those selling them). However, we also find some of the simpler annuity contracts can be competitively priced and offer good value.
Annuities come in a variety of flavors and can attach many different features (called riders). We highlight two particular annuity strategies that insure life-long streams of payments. While there are other products with different types of guarantees and riders, we view guaranteed life-long income as the primary differentiating factor of annuity contracts versus other investments.
Annuity Strategy 1: The Single Premium Immediate Annuity (SPIA)
The first strategy is based on a very basic annuity product: the single premium immediate annuity (SPIA)[2]. The investor pays an insurance company a lump sum of money. In return, they receive a guaranteed[3] stream of cash flows for the rest of their life. There is no value to the contract after one passes.
The SPIA is the most straightforward annuity as there are very few moving parts. Naturally, the age of the investor will impact the amount of cash flows (younger investors will generally receive more but lower payments). There are also various options that can be added to the SPIA or other annuity contracts. In our view, there are three such options (riders) that can be useful when added to a SPIA.
The first option we find most relevant is an inflation adjustment. This feature is naturally more relevant when payments are expected to span longer periods. The second is the joint & survivor life (JSL) feature. This option extends the fixed annuity payments to whomever lives longer. It will naturally reduce the amount of the payments because the payments are guaranteed for a potentially longer time (if the additional person lives longer).
The third key feature is the life with period certain (LWPC) rider. LWPC guarantees payments are made for a minimum number of years regardless of the annuitant’s life span. The purpose of this option is to protect against situations where one purchases an annuity but deceases shortly after – thereby losing out on future payments.
| Two related notes
Costs: Regardless of the products or features one considers with annuities (and other investment products), it is imperative to understand their costs. Some are explicitly disclosed while others are embedded in the products’ specifications and payouts. We like to take all of the fees and costs over the expected lifetime of the product into account to estimate the total costs. This is especially important for more complex annuities where the costs can be significantly higher and less transparent. Estimating annuity costs sometimes only requires some basic math and mortality tables. Other times it is more complex. Notwithstanding, we find cost analysis are rarely conducted. We suspect this is because those selling annuities generally prefer to avoid discussing costs. In our experience, SPIAs are typically competitively priced. In other words, the expected internal rate of returns for SPIAs (based on simple math and mortality tables) are generally in line with yields for investment grade bonds. We have not found this to be the case with more complex annuities as they tend to impose or embed significantly higher fees. Return of capital (RoC): In the case of SPIAs and similar products, it is also important to realize a significant portion of annuity payments are return of capital (RoC). The insurance company will be investing your money and earning a return. However, the cash flows they provide return parts of your original investment alongside some of the return. This is especially true in the early years when money has not been invested for long. This has three important implications. First, there is no residual value to an annuity contract after one passes (assuming no such riders apply); the principal is effectively returned via the stream of cash flows which embed it and nothing is left at the end. Second, the cash flows generated by a SPIA should be higher than those generated by investment grade bonds because the bond only pays interest (but then returns the principal at maturity). Investment professionals selling SPIAs (or other annuities) may talk about higher returns, but they may not be comparable to stocks or bond returns because the SPIA payments are inflated with RoC. The third implication relates to taxes. A portion of the cash flows that is deemed to be return (i.e., not RoC) is taxed as income (assuming it is taxable money). Even if the total payments are the same through time, the balance between return and RoC changes. This can cause the tax profile to change (typically increase) through time as well. As such, one may need or prefer to structure annuities in such a manner to target after-tax cash flow. To be clear, we are not tax experts and always recommend consulting with a tax professional when considering tax-related issues with investment products and strategies. |
Annuity Strategy 2: The Guaranteed Lifetime Withdrawal Benefit (GLWB)
The second annuity strategy we highlight providing life-long income relies on the guaranteed lifetime withdrawal benefit[4] (GLWB) rider. In this case, money is invested in a standard portfolio mix (e.g., 60% stock and 40% bond funds), but the insurance company guarantees the investor will be able to withdraw a fixed percentage from this portfolio every year until the investor passes – even if the portfolio is depleted. The guaranteed percentage is typically applied to the base value of the portfolio when withdrawals begin. In some cases, this base value may reset higher as the value of the underlying portfolio increases. So the amount of guaranteed withdrawals will increase as the percentage is applied to a higher base.
The value of the GLWB rider derives from the insurance company’s guarantee of the cash flows even if the underlying portfolio is depleted (until the investor passes). This can provide peace of mind in guaranteeing a minimum level of cash flows for an investor’s lifetime while possibly allowing for these cash flows to increase.
The GLWB rider typically imposes a fee greater than 1% a year. For example, low-cost provider Vanguard charges 1.2% for this rider (in addition to other fees[5] that bring the total fee closer to 2%). Over a period of, say, 25 years the GLWB fee would impose a cost of approximately 26%[6]. Adding another 0.30% for M&E[7] expenses, this figure gets over 30%. We find performance headwinds of this magnitude to be slightly ironic. On the one hand, the investors are paying money to insure themselves against portfolio depletion. On the other hand, the cost of the insurance significantly increases the likelihood of portfolio depletion.
We find the GLWB rider to be very popular as it provides a valuable service to investors. However, the costs make these riders inefficient in our view. That is, they cost too much relative to what they deliver. Most of the marketing we see and hear focuses on the guarantees and other benefits – not the costs. Moreover, we find investors often do not fully understand what they are paying for or how much.
| Note: There is another way to provide lifelong income with annuities. Fixed, indexed, and variable annuity contracts may be annuitized. That is, the investor may convert their annuity contract into a guaranteed series of payments for the rest of their life – with nothing left at the end (similar to a SPIA). The amount of the payments depends on the value contributed plus any earnings (fixed or market returns) as well as any specific bonuses or minimums credited to the account by the insurance company. For example, an insurance company might offer an upfront 10% bonus so your account value increases by 10% at the very start. They may also offer guaranteed minimum returns (e.g., 6%) so that the account value goes up by at least that amount each year.
A free 10% increase and guaranteed 6% returns in a world with interest rates near zero might sound too good to be true – and it is. Well, at least these benefits do not tell the whole story. The truth is bonuses and guarantees like these are only relevant to investors who annuitize their contracts. Those who decide to take the money and run (spend, stash, or invest elsewhere) do not necessarily receive these benefits. Perhaps more importantly, the amount of bonuses and guaranteed returns are meaningless unless one knows the rate at which their account value will be converted into lifelong payments. In other words, one might be able to promise attractive annual returns in the accumulation phase if, upon annuitization, the resulting account value is converted into a small amount of income per year. In other words, the percentage rate at which the account value is converted to annual income is critical. A rate of 6% ($6 per year per $100 of account value) equates to 50% more income and thus 50% more value than a rate of 4% - regardless of how much the account value is worth. This figure is not often discussed, but in our view it is the most critical variable. Figure 3 below illustrates how attractive looking bonuses and guaranteed returns may only provide illusory benefits once one considers the rate at which they are converted to income. Notice how all three products with different levels of guaranteed bonuses and returns generate approximately the same amount of income after annuitization. The devil is in the detail and annuity products are far from standardized. Accordingly, it is important to identify all of the relevant moving parts and work out the math. Unfortunately, the math can get very complex as annuity products add more and more features. In fact, this complexity has led some states to make these two-tier[8] annuity products illegal. |
Figure 3: Hypothetical Return, Bonus, and Conversion Scenarios (20-year accumulation period)
| Upfront Bonus | (Guaranteed) Annual Return |
Annuitization Rate |
Annual Income |
| 5% | 6% | 5% | $16,837 |
| 10% | 7% | 4% | $17,027 |
| 20% | 8% | 3% | $16,779 |
Source: Aaron Brask Capital
Safe Withdrawal Rates (SWRs)
William P. Bengen was an MIT-educated rocket scientist who ended up in financial services. He is credited with conducting the research that led to what is often called the four percent rule. In particular, his original 1994 Journal of Financial Planning article indicated investors who maintained 50/50 (stock/bond) allocations would not be likely to prematurely deplete their savings if they withdrew 4% of their original portfolio value in the first year and then increased their withdrawal dollar amount by the rate of inflation in subsequent years. While Bengen called this the SAFEMAX withdrawal rate, this percentage has become known as the safe withdrawal rate (SWR). His pioneering research has been corroborated, scrutinized, and expanded by many in the academic and practitioner communities – including himself.
We believe running historical simulations can be helpful and Bengen’s original research on the topic was and is most certainly illuminating. However, there is no doubt there are potential risk scenarios history is yet to reveal. That is, it is possible markets may behave in different or unforeseen ways in the future. While Monte Carlo (MC) simulations can help identify some of these, MC results are only as good as the models used to generate the simulations and can thus still leave investors vulnerable.
The standard solution for addressing these vulnerabilities is to use more conservative assumptions. For example, one might reduce the expected returns they use in their simulations. Alternatively, one might just reduce their SWR. If historical simulations indicate a SWR of 4%, then it may be prudent to implement the strategy using a lower withdrawal rate of 3.5% or 3.75%. We believe this less scientific approach to risk management is a step in the right direction but not necessarily optimal.
| Note: The GLWB option we discussed in the previous section could effectively be viewed as an insured SWR strategy. However, GLWB riders may offer additional options (e.g., potential for cash flows to grow) making this comparison less relevant. |
In our view, one could do much worse than follow a well-constructed SWR strategy. As we stated in the previous section on annuity-based strategies, the cost of insuring lifelong cash flows can be expensive (and in some cases prohibitive). While many professional advisors will offer portfolio rebalancing services, these and other SWR analysis tools are available online for little or no cost these days. The rise of robo-advisors is certainly putting pressure on fees that were historically earned for implementing SWR strategies. In some cases, robos are displacing advisors who provided these services. Notwithstanding, the human element is certainly not worthless. Many investors take comfort in knowing a professional is overseeing their strategy and ensuring it will help them meet their goals.
Just as with annuity products, one must weigh the benefits against the costs[9] when considering enlisting the help of an investment professional. Moreover, they should do as much due diligence as is reasonable to assess the competence of potential advisors so they can be confident in their ability to add value and execute their strategy. Whether one decides to use an advisor or do it themselves, the following is a list of what we believe to be important considerations for implementing SWR strategies that could be useful:
- The period of history used for analyzing SWR strategies should be long and include relevant periods. For example, data over the last 30-40 years reflects the tailwind provided by declining interest rates. This may not be comparable to market performance going forward.
- There may be potential basis risk with respect to the investments used. For example, the composition of stock and bond indices has changed over the years. Thus, these markets may perform differently going forward.
- Make sure historical analyses reflect the costs of the investments and investment strategies. For example, we see many analyses using index performance and thus do not reflect the impact of costs. It is important to consider both the costs of the investments (e.g., fund management fees) as well as any advisor-related fees for executing the strategy.
- The choice of models and parameters used for Monte Carlo simulations will make all the difference. For example, something as simple as assumptions for asset class returns can dramatically Impact the results – perhaps making them overly optimistic or pessimistic. There are also more technical issues relating to how models attempt to capture the more complex relationships between assets using price correlations or using these correlations to generate simulations.
- Integrating valuations will also impact SWR analyses. While some consider the use of valuations in determining asset allocation blasphemy, there is a growing body of research indicating valuations can significantly improve results.
Structured Investment Income (SII)
Living off dividends and letting capital appreciate in the background may only sound like a dream to many. However, if one has enough to retire, then our structured investment income (SII) strategy may be able to restructure their investments in such a way to make this a reality.
The SII model and process are relatively simple and transparent. Our ultimate goal is to match the natural cash flows generated by investments with those required for retirement (or other purposes). This is a significantly different approach than relying solely on insurance company guarantees or statistical market price simulations for SWR strategies.
We first look at the liability side of the equation by estimating the annual budget for retirement spending. Moreover, we attempt to approximate a smoothed budget by eliminating as many expected and unexpected expenses as reasonably possible. This requires identifying likely one-off expenses one may anticipate (e.g., a home or boat purchase/sale, college tuition(s), or any other commitments). It also involves minimizing unanticipated expenses through the use of insurance and cash reserves. Our goal here is to visualize one’s required income for retirement as a relatively smooth and presumably increasing (reflecting inflation) stream of required cash flows. Our motivation is to create a budget profile that is more comparable to the cash flows generated by a SPIA and the natural[10] income from other investments.
We then look on the asset side of the equation by estimating one’s total liquid, investable wealth. Our goal here is to come up with an approximate figure that represents the amount of money that can be allocated to various investments to generate cash flows. Accordingly, we subtract the appropriate amounts that would be earmarked for the expected one-off expenses uncovered above as well as any monies required for insurance and cash reserves. This step effectively carves out the one-off expenses from our analysis so we can focus on aligning smoother budget and income profiles.
| Note: We hope it goes without saying, but we strongly suggest basing retirement figures, calculations, and analyses off of conservative assumptions because the consequences of not doing so (premature depletion of wealth) can be dire. |
Once we have estimated the investable wealth and smoothed required budget needs, we calculate the income that would be generated if we (hypothetically) allocated all of the money into a SPIA (preferably inflation-adjusted). If this income is enough to provide for one’s retirement spending, then the answer to the retirement question may be yes.
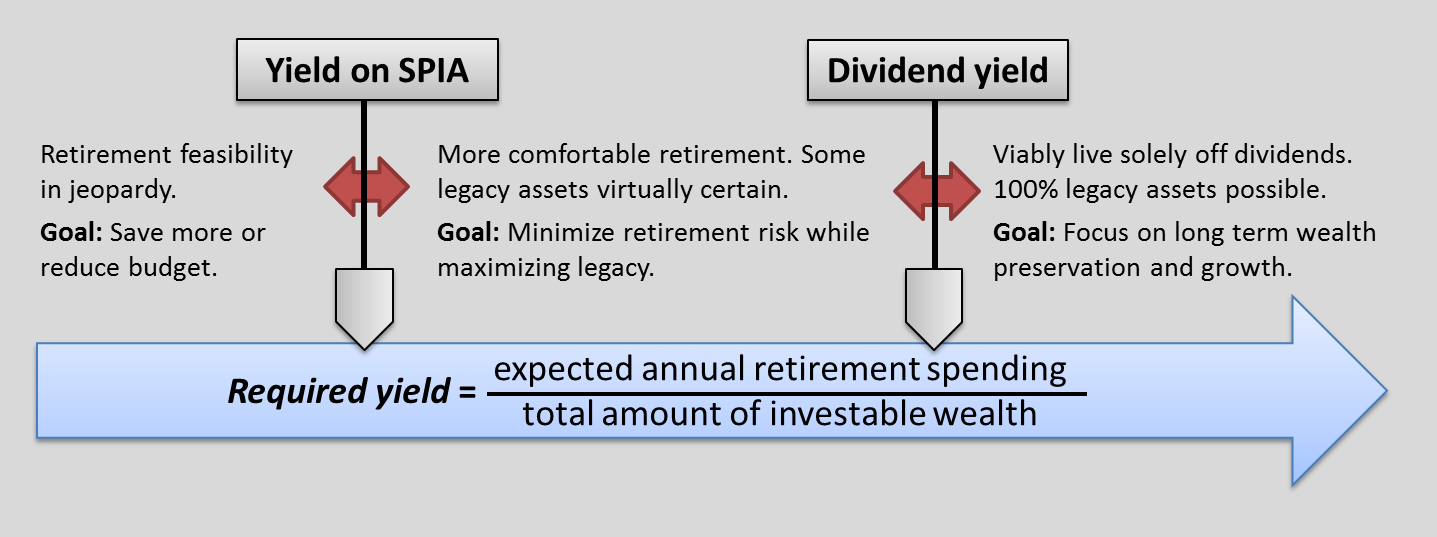
Brushing some details (e.g., inflation, tax, insurance and cash reserves, etc.) aside, this process provides a relatively straightforward litmus test that can help us determine the feasibility of retirement. Below we consider three possible situations based on the required yield – which we define as the ratio of one’s annual spending budget divided by their wealth.
Case 1: Failing or barely passing the retirement feasibility test
If one fails this litmus test, then contributing all of their wealth to a SPIA would still not cover their retirement spending needs. Even if one barely passes the test, this would leave very little margin for error and leave little or no cash reserve. If possible, one should attempt to save more money to add to their nest egg, reduce their spending budget, or employ a combination of both. Failing the SPIA test will preclude any of the other alternative annuity strategies as the guaranteed income from these other approaches will be less than the SPIA (since it guarantees no residual assets and effectively consumes all of the money). A tight situation like this will also make SWR strategies extremely risky. Properly constructed simulations will almost certainly indicate unacceptably high probabilities of premature wealth depletion.
Case 2: Comfortably passing the retirement feasibility test
If one comfortable passes this test, then they should have sufficient savings to purchase a SPIA to cover expected retirement spending needs and still have money left to establish a cash reserve and some to invest. This opens the door to some interesting options, in our view. In particular, let’s assume these investments will also generate income. Now the SPIA together with the investments will provide excess income relative to the retirement budget (since the SPIA alone covers the required income). While one could simply reinvest the dividend or interest income back into the portfolio, let us consider another option.
Depending upon the reliability of the investment income, one could choose to allocate less to the SPIA and more to an investment portfolio while maintaining the required income level. We find that using a portfolio of high-quality, dividend-paying stocks presents a compelling option. Given that a SPIA is effectively a fixed income investment that behaves like a lifelong portfolio of bonds, complementing it with an allocation to equities seems sensible in our view.
While many may think of stocks as being very volatile, it is important to understand two key factors here. First, dividends are much more stable than market prices. This is especially true of high-quality stocks. Please read our article Destroying Steady Income for a more detailed discussion of income stability. Second, the investor would only rely on the dividend income from these stocks and not the market price. This removes the financial plan’s dependence on market price movements and allows the equity portfolio to grow in the background.
While the math is not complicated, there are several considerations for how to balance allocations between a SPIA, stocks, bonds, and other investments. As mentioned above, reliability of the investment income is important. If one chooses bonds with reliable income, will the combined income from the SPIA and the bonds cover inflation? Accordingly, growth of this income is also a key factor. The growth of dividends, for example, can be used to address inflation risks. For example, if one anticipates sufficient growth from dividend income, they may be able to forego an inflation rider on the SPIA. This can significantly increase the guaranteed yield and perhaps allow one to allocate even more to stocks and thus allow for more capital to appreciate in the background while they live off of dividends.
Another angle to consider is how important the marginal income is to the investor. If 100% of the investment income is used to fund non-discretionary spending, one may be inclined to take less risk. If it is earmarked for discretionary spending, one may possess some additional flexibility with which to take more risk. It could be sensible to consider these risks upfront and perhaps calibrate the amount of income derived from stock dividends to the ratio of discretionary versus non-discretionary spending in one’s budget. In other words, make sure one’s necessities are covered by the guaranteed income so the risk only applies to more discretionary spending.
While screening for high-quality stocks can reduce risk to the dividend income, it will not go to zero. Accordingly, the cash reserve can also play a significant role here. In particular, it could be used to support some of the additional income risk that comes with dividends. Let us use the recent credit crisis as an example. Dividends paid by S&P 500 companies fell by 23% during this period. If one’s strategy allocated 60% to an S&P 500 portfolio yielding 2%, then they would experience an income shortfall of approximately 0.3%[11]. Assuming as many as 10 years of shortfall during one’s retirement would only require a 3% cash reserve (based off of the total portfolio value – not just stocks). These cash reserve requirements could be lower in the case where one screens for quality stocks to lower the risk and severity of dividend cuts.
While some annuity strategies effectively lock one in for the long term and failing SWR strategies can do irreparable damage to one’s retirement plan, our SII strategy allows investors more flexibility. Indeed, one always maintains the option to convert some or all of their equity allocations to cash, a SPIA, or other investments. We actually prefer to monitor both the actual performance of one’s SII strategy as well as what redo options are left on the table. That is, we like to ensure our investors have and are aware of backup options. We find this cautious approach helps clients feel more comfortable with their retirement and financial plans.
The above options represent tactical adjustments to be made when the risks surface. However, we believe a well-constructed SII strategy should avoid these need for such measures in all but the most extreme situations – those that would endanger the other retirement strategies we discussed as well. In other words, we believe our SII strategy manages risk better than the other strategies we discussed but still manages to provide more flexibility.
At the heart of this strategy is the notion of generating a portion of the required retirement income outside of the SPIA. In the case of stocks, this creates a tradeoff between some additional risk to the income stream and the ability to preserve and grow more capital. We believe high-quality stocks provide an optimal balance of risk and performance by reducing the potential likeliness and severity of dividend cuts while allowing for greater growth without the more risky dependence on market prices.
Case 3: Living off the dividends
In the case where one passes the retirement feasibility test with flying colors, it may be possible they can simply live off dividends (and/or interest) without the need for a SPIA or other lower-risk income investments. If markets are currently providing a dividend yield of, say, 2%, then one must possess wealth approximately 50 times (1 ÷ 2%) their retirement spending budget in order to live off of the dividends.
For those fortunate enough to be in this situation, risk embodies something entirely different relative to the above two cases. Instead of retirement funding or wealth depletion, risk management focuses more on how to preserve and growth wealth over much longer time horizons. We discuss some of these tradeoffs in our article on Asset Allocation but please feel free to contact us to learn more about our multi-generational planning strategies.
Many people target a specific level of (liquid) wealth for their retirement. This is approach potentially dangerous. The amount of wealth one requires to retire (or for any purpose) is highly dependent on the prevailing level of valuations (e.g., interest rates and dividends yields). If valuations are more attractive with higher interest rates and dividend yields, then each dollar saved for retirement will generate more income and return. More generally, we find many investment professionals rely on historical market returns to parametrize their simulations and SWR strategies while ignoring current valuations. We believe this approach is naïve and imposes unnecessary risk for these retirement strategies.
Put another way, the primary factor determining which of the above categories one falls into and what options are available is not absolute level of wealth; it is the required yield (ratio of the amount of expected spending relative to that wealth). Moreover, this ratio must then be compared to the current market yields of the annuity products and investment options. Currently, interest rates and dividend yields are at historically low levels. This raises the bar for each of the three categories above as each dollar of retirement spending requires more capital to generate the cash flow. Hopefully, those looking to retire and live off of income generated from investments have benefited from the tailwind that brought market prices to these higher levels and thus lower yields.
Figure 4: Retirement Feasibility Spectrum as a Function of Wealth and Spending Budget
Source: Aaron Brask Capital
| Note: We used SPIAs in most of the discussion above. However, we can also construct portfolios utilizing other investments to provide fixed cash flows. These could be bond ladders or perhaps estate planning tools[12] such as charitable remainder annuity trusts or private annuities. We discussed how bond ladders, for example, could provide relatively more stable income than bonds funds and other managed accounts in our article Destroying Stable Income. It is worth noting, however, bond ladders do not provide the lifelong guarantees or growth and these are two key factors provided by the annuity and equity allocations, respectively. |
SII in a Nutshell
The general structure of a SII portfolio would be a SPIA (or similar annuity[13]), an equity income portfolio, and a cash reserve. As we alluded to in the note above, we could also add a bond ladder to replace some or all of the annuity and equity allocations. With or without this component, our goal with SII is to construct a robust financial plan most investors can understand. Instead of thinking of the portfolio as a single figure subject to the vagaries and volatility of market price volatility, each component serves a role in generating income to target the required cash flow liabilities.
This modular approach is different from SWR strategies in that they expose the income to market risks and create market dependency. In our view, the SII strategy can help minimize risk to the income stream while isolating[14] and maximizing exposure to growth via the equity component. Moreover, this strategy allows for some flexibility and liquidity for emergencies or other events that might catalyze a change of plan (or mind!).
Figure 5: Structured Investment Income (SII) Reduces Market Dependence

Source: Aaron Brask Capital
Some Advantages
We believe our SII strategy provides several advantages. Unlike the complicated annuity products and options, SII provides a direct and structural solution to target the actual liabilities (stream of cash flows). It also does not rely on statistical models and simulations. This allows for greater simplicity and transparency so investors can better understand their portfolios.
Perhaps the most important benefit of the SII strategy is that it reduces market dependency by delineating income and market performance. Indeed, the income is generated naturally by the investments so principal left intact to grow in the background unlike SWR strategies that sell off parts of the portfolio to generate synthetic income. In addition to reducing market dependence, the asset-liability approach of matching cash flow liabilities over longer durations naturally reduces risk to the overall strategy.
The SII strategy also involves fewer fees. We find simpler annuity products like those we recommend (SPIA and similar) are competitively priced and thus reflect minimal if any fees relative to market yields[15]. Moreover, SII requires minimal if any rebalancing and thus allows investors to avoid paying advisors an asset-based fee[16] to implement such a strategy. Aside from potential upfront or ongoing planning charges (typically insignificant relative to percentage-of-assets fees), the primary source of fees will come from management of the investment allocation. However, even this allocation will be smaller due to the SPIA allocation.
| Example: In a typical advisor-managed SWR strategy, the advisor will typically charge a percentage fee to the whole portfolio. They will then allocate the portfolio to various funds and strategies that charge their own fees. This creates two percentage fees applied to the whole portfolio. These fees could easily total 2% or higher. If, say, 50% of the portfolio was allocated to competitively priced SPIAs and the other 50% to an index-based portfolio of stocks, the total fees as a percentage of the whole portfolio value could be near zero. While reducing fees is generally sensible, we do caution investors to be aware of potential hidden costs. For example, our article Index Investing: Low Fees but High Costs shows how low-fee index products and strategies can embed significant costs that far outweigh the low management fees they advertise. |
Yet another advantage of the SII strategy relates to its flexibility. Of course any capital invested in a SPIA or similar annuity will be locked up. However, the rest of the capital is liquid[17] and can generally be easily reallocated. This provides investors with increased flexibility. Moreover, because of the robustness of this strategy (stemming from its focus and ties to the liabilities), it affords investors more of a redo option relative to other strategies where markets can take one off an intended course make all redo options less feasible.
Some Disadvantages
In addition to the math behind this strategy and advantages we highlighted above, one must also consider their comfort level with various facets the SII strategy. For example, many investors are reluctant to say goodbye to significant portion of their wealth by committing money to insurance companies for annuity contracts for the rest of their life[18]. Contracts such as SPIAs may have no beneficiaries[19] since there is no capital left. SPIAs also lock in current interest rates. Given the historically low levels we see right now, this is a valid concern[20].
Another concern that can arise relates to the perceived volatility. When a significant portion of a portfolio is allocated to an annuity and the remainder to equities, it is possible for account statements to appear to be more volatile if they do not reflect the present value of the annuity. In a typical stock and bond portfolio, both of those values are aggregated. Accordingly, much of the volatility in the stock portfolio is balanced by the often offsetting risks in the bond portfolio. However, depending upon how one’s annuity value is reflected in their statements and whether their equity portfolio is held at the same institution as their annuity contract(s)[21]. As a result, one may perceive greater percentage volatility in the portfolios when it is actually balanced by the value of the annuity contract(s).
Perhaps the greatest risk we perceive for the SII strategy is the risk to the dividend income. However, as we mentioned before, we recommend investing in high quality companies with established histories of paying and increasing dividends to mitigate this risk. Indeed, there are many companies whose record of paying dividends is longer than the life of many insurance companies. In general, we find most investors overstate the risks to fundamentals such as dividends based on their perceptions of market price risks. In our article Destroying Steady Income Streams we illustrated the reliability of dividend streams given even the most basic quality filters.
Notwithstanding these risks, a well-structured SII plan should be able to withstand such events. Nondiscretionary liabilities should be managed with minimal risk (e.g., SPIA income). In an extreme case where there is shortfall, however, one might simply rely on their cash reserves. However, they may also leverage the flexibility and liquidity of the SII plan by converting some of the equity capital into another annuity.
We also brushed details relating to the taxation of the SPIA under the rug. Later cash flows provided by SPIA contracts may incur more (income[22]) tax as they embed more interest and less return of capital. While this may offset with some of the anticipated dividend growth, it is sensible to work with a tax professional to estimate the tax liabilities and feed them back into the liabilities. These are straightforward calculations and it is easy to structure one or more annuity contracts to address this potential issue.
Fine Tuning
While we hope we have described the major components of our SII strategy, it is important to understand some of the moving parts that allow us flexibly construct a financial plan. We briefly discuss some of these below.
Annuities: While we used a SPIA to illustrate our points, one could also use a deferred version of this product called a deferred income annuity. This could particularly useful for those planning their retirement in advance with the ability to purchase such a contract without needing the income for some years. As we highlighted before, it always makes sense to revisit the math and compare to prevailing market rates. It is possible CDs, short term bullet bonds, or other products offer more competitive rates at the time.
Inflation: Without doubt, inflation represents a real risk that should be addressed within the context of any investment strategy. Within the context of our SII strategy, one has four options to manage inflation risk. The first is within the SPIA. Most insurance companies offer options to adjust the payouts according to an inflation index. The cost of this will be reflected in the lower rate of income paid out initially.
The second option is the allocation to stocks. Stocks, especially higher-quality stocks, attempt to use their pricing power to maintain their profit margins and return on capital. As a result, their profits tend to grow when the inflation occurs and increases the costs of their materials and capital equipment rise.
The third and fourth options apply when one decides to integrate bonds into the strategy. One may elect to purchase treasury inflation-protected securities (TIPS) instead of conventional bonds. The cost of TIPS is reflected by their typically lower yields since they offer potential upside to the principal. Alternatively, one can use bond ladders so that funds from maturing (and called) bonds can be reinvested and thus better reflect prevailing rates of inflation. In this case, one can use the duration of a ladder to manage how quickly principal is recycled through the market. Shorter duration ladders will turnover more and thus become more closely tied to prevailing levels of inflation. However, shorter duration bonds impose an indirect cost as yield curves are normally upward sloping (i.e., they reward investors who commit to longer maturities with higher interest rates).
Dividends: As we have mentioned, SII mitigates the risk of market price movements, but is still exposed to the risk of dividends being cut or eliminated. We believe most investors (and potentially advisors) would be positively surprised by the lack of volatility in dividends streams provided by the market overall. Moreover, our research indicates filtering for higher quality dividend-paying companies reduces volatility even further. For those interested in better understanding the dynamics between stocks and inflation, we recommend reading Warren Buffett’s thoughts on the topic in his 1983 letter to shareholders where he discusses the inflation-related benefits of a high return on capital business (See’s Candy). We also discuss this risk in our Destroying Steady Income article.
Cash reserve: Another moving part we can manage is the cash (or near-cash[23]) reserve. We believe it is important to maintain a cash or near-cash reserves to cover unexpected expenses or disruptions to income. If one were to invest in an S&P 500 portfolio or index fund, then we might base a minimum cash reserve amount on the volatility of its dividend stream. As discussed above, S&P 500 dividends fell by approximately 23% during the credit crisis and did not rebound to their previous levels for four years[24]. Having 1% of the portfolio as a cash reserve would have covered the dividend shortfall relative to its previous peak.
Brief Strategy Comparison
| Single premium immediate annuity (SPIA) | Guaranteed lifetime withdrawal benefit (GLWB) | Safe withdrawal rate (SWR) | Structured investment income (SII) | |
| Simplicity & transparency | Straightforward. Does what its name implies. | Straightforward benefits but complex costs and performance. | Straightforward strategy to implement based on complex statistical models and simulations. | Easy to understand structural model and modular approach. |
| Market dependence | Only at inception to determine the yield. None after. | Low for guaranteed income but high for residual value. | High. Both portfolio and income 100% exposed to market risk. | None |
| Liquidity | Almost none. Once contract is in place, one is committed- though sale to a third party is possible. | Limited. Surrender charges on early withdrawals. Fees wasted if strategy abandoned. | High. Assuming liquid investments are chosen, portfolio should be easily convertible to cash. | Almost none on SPIA but high for rest of the portfolio. |
| Flexibility | Some optional riders to choose from. | Some optional riders to choose from. | Moderate at start but can be limited with time or wealth depletion. | High. Guaranteed income allows for more flexibility and risk taking. |
| Redo option | None | Costly | Possible but depends on portfolio performance. | None for SPIA allocation but possible for rest of portfolio. |
| Maintenance | None | Low | Moderate to high | Low |
| Fees | Low. Pricing is competitive. | High. Add almost 2% annual fee on top of investment fees. | High. Advisor and fund management costs can easily reach 2% or more. | Low. Removes need for asset-based advisor fees. |
| Tax risk[25] | Low. Fairly predictable but taxable flows taxed as income.[26] | Low. Deferred tax on capital gains (CG) but withdrawals taxed as income. | Low to moderate. Rebalancing triggers capital gains and synthetic income taxes at CG rate. | Low. SPIA tax risk is low and there is no rebalancing. Favorable tax rates for dividends. |
| Income risk | Low. Even failure of insurance company is backed by state guaranty program. | Low. Even failure of insurance company is backed by state guaranty program. | Can be anywhere from low to high. Depends on assumptions and market performance. | Low. Liability focused strategy targets income and dividend risk is low. |
| Inflation risk | High unless inflation rider chosen. | Moderate. Depends on time period and underlying portfolio composition. | Low to moderate. Depends on time period and portfolio composition. | Low. Inflation protection via SPIA rider and high quality equities. |
A Word on Risk
In the context of investments, many advisors define risk by as volatility – a statistical formula measuring the variation of an investment portfolio’s market value. While relevant to some investors[27], we find this definition of risk wholly inadequate for assessing risk in the context of a financial plan. One reason we do not like to place too much focus on volatility as a risk parameter is because it is largely uncontrollable. Market prices can take on lives of their own and deviate significantly from underlying fundamentals. The more financial plans are exposed to market price movements, the more they are vulnerable to unexpected moves and failing to achieve their intended goals.
We view risk more as a multi-dimensional concept relating to ones goals and the feasibility of attaining them. In this article, we have effectively focused on two dimensions of risk we find most relevant to retirement planning. The first is risk to one’s retirement income and maintaining one’s standard of living. Without doubt, this is a top priority. However, this is typically balanced with the second risk: how much residual portfolio may be left for legacy-related goals such as heirs, charities, etc. The planning strategy one chooses can greatly impact the balance between these two dimensions of risk.
In the case of the annuity products we highlighted, market risk is removed from the income stream by the guarantees. This most certainly can provide a great deal of comfort to retirees. However, we find annuities such as those using the GLWB rider actually increase the risk to the principal. Indeed, their higher fees will impose a certain and significantly negative impact on the underlying portfolio’s value.
In the case of SWR strategies, their success naturally depends on market performance as parts of the portfolio are sold to generate one’s retirement income. Given the importance of retirement income and dire nature of depleting one’s wealth prematurely, market risk must be taken seriously. Given that SWR strategies entwine income with market risk, it is only natural for investors and their advisors to structure SWR portfolios more conservatively. In our view, this conservative market positioning can cost investors significantly over the long term (see our Asset Allocation article) and thus impose some gravity on any principal that may be leftover.
In the case of our structured investment income strategy, we attempt to decouple income from market risk. This allows one to take more market risk to grow their portfolio – thus leaving more to heirs and other causes – without compromising their retirement. SII targets the required income stream via a combination of guaranteed SPIA income and reliable stock dividends. In other words, the income stream depends on the fundamental performance of the companies in the stock portfolio (i.e., their dividends) but not their market prices. Given that fundamentals (dividends in particular) are much less volatile than market prices (especially in the case of higher quality stocks), this makes forecasting and managing risk more reliable.
In our view, the end result of the SII strategy is a more modular financial plan whereby we can isolate and compartmentalize risks. This allows for better optimization of each portfolio so we can simultaneously minimize risk to the income stream while increasing the upside potential for the residual portfolio. Indeed, the investment portfolio within an SII strategy can be left to grow without being infringed upon for withdrawals or rebalancing.
A Hypothetical Example and Some Observations
Consider a single 65-year-old investor with $1,000,000 in investable savings (after one-off expenses, insurance, and cash reserves have been addressed) who needs an additional $40,000 per year to complement his pension and social security income for now but will need to adjust this amount accordingly to inflation going forward. This translates into a required yield of 4% which we find to be a fairly typical situation where the investor has a well-funded retirement. Below we discuss how the three strategies we have highlighted in this article would have performed using 20-year historical simulations[28]:
SWR: We first consider a 60% stock and 40% bond portfolio[29]. Our simulations indicate a rebalanced SWR strategy will leave a median terminal wealth multiple of 3.0x the initial wealth with inflation-adjusted withdrawals taken over 20 years. However, the dispersion around this average is wide (25th and 75th percentiles at 1.8x and 4.7x initial wealth) while wealth depletion occurred just 1% of the time. The variability and depletion risk is primarily due to the strategy’s dependence market trajectories, asset class (stock and bond) correlations, timing of withdrawals, and rebalancing dynamics.
GLWB: In the case of using guaranteed life withdrawals, we assume the underlying portfolios perform just as they did within the SWR strategy but with higher fees for the annuity and GLWB feature. While we maintain our assumption of zero fees for the underlying stock and bond portfolios, we approximate fees of 2% per annum for the annuity with GLWB rider. Our simulations indicate these higher fees consumed approximately 1/3 of the portfolio value in exchange for mitigating depletion risk. The median terminal wealth was approximately 2.0x initial wealth and the 25th and 75th percentiles were $1.2x and 3.1x initial wealth
SII: Now let’s consider a 60% equity and 40% SPIA portfolio. Assuming the SPIA will yield approximately 7%, this generates $28k of income while a 2% dividend yield will provide another $12k to meet the $40k figure. This strategy resulted in median terminal wealth multiple of approximately 3.2x the initial wealth with the inflation-adjusted withdrawals taken over 20 years. The variability in the terminal wealth was slightly higher with 25th and 75th percentiles of 1.7x and 5.7x initial wealth.
| Note: The simulations we used for the above examples were based on historical data. There are two important risks that may surface going forward that are not necessarily reflected by our simulations based on historical performance data. First, we believe the current high valuations in both the stock and bond markets will cause almost all investment strategies to perform worse than they did over this historical period. We discuss this more in our article More Market Correction to Come. Second, it is important to realize that SWR (and hence GLWB) strategies have benefited from low and negative correlations historically[30]. Going forward, correlations could be higher especially if interest rates move higher and simultaneously hurt both stock and bond prices. These additional risks further support the benefits of using an SII strategy to remove market risk from a retirement strategy. |
Overall, the results for the three strategies above illustrate precisely the tradeoffs we expected. Those who recall the 4% rule we highlighted earlier in this article may have recognized that was the basis of our example retirement scenario – 4% of initial wealth taken in year one and then that dollar amount adjusted for inflation in later years.
The SWR strategy indicated very low risk of wealth depletion (just 1%) and terminal wealth leftover for heirs and other causes was fairly wide. Jumping ahead we saw the annuity with GLWB strategy removed this wealth depletion risk but imposed a significant cost to the remaining wealth. To be clear, the value of the terminal wealth was reduced by 33% (relative to the SWR strategy) to avoid the risk of depletion which occurred just 1% of the time within the SWR simulations. In our view, this is a very expensive way of insuring one’s retirement income.
Lastly, the SII strategy also reduced the wealth depletion risk. The median wealth was only slightly higher than for the SWR strategy (3.2x initial wealth versus 3.0x) and the 25th percentile was slightly lower (1.7x initial wealth versus 1.8x). Interestingly, even though the 25th percentile was slightly lower, this variability did not impose additional risk to the income stream since it was covered by the SPIA and dividends (i.e., did not depend on the market). Indeed, there was no wealth depletion[31] in the SII simulations.
Notwithstanding, the most notable difference was the upside. While the distribution of outcomes was similar on the downside, SII offered significantly higher upside potential with the 75th percentile at 5.7x initial wealth versus 4.7x for SWR – an increase of more than 20%. Higher percentiles indicated even more upside. For example, the 99th percentile was 15x initial wealth for the SII strategy and 10x for SWR – a 50% increase.
The SII results reflect the precise tradeoff we targeted: reduced risk to the income and increased variability of terminal wealth with more upside potential. The additional variability of the terminal wealth was expected given that SII effectively increases the percentage allocation to equities through time. Indeed, the SII stock portfolio is left to grow while the remaining value of the SPIA diminishes. This contrasts SWR strategy in that it maintains (constrains!) the equity allocation at 60% via rebalancing.
Note: The above analyses assumed no management fees on the investment portfolios and ignored transaction costs associated with rebalancing (e.g., capital gains). However, the inclusion of fees would further support the SII strategy for two reasons. The first is that only 60% of the SII portfolio incurs investment management fees since the other 40% was in the SPIA (where fees are embedded in the payout yield). The second reason is that investment management fees are generally higher within the annuity products.
Executive Summary and Conclusion
| In this article, we broke down financial planning into three primary components: asset, liabilities, and the investments linking them together. We explained how assets and liabilities can sometimes swap roles in the context of financial planning (e.g., most people consider their house as an asset, but it often shows up as a liability due to the associated costs).
We then highlighted three strategies associated with retirement: annuities, safe withdrawal rate (SWR), and structured investment income (SII). We explained how annuities can provide valuable lifetime income guarantees but often come at a significant cost that is not always evident. In general, we recommend avoiding more complicated annuity products. However, we find simpler annuity products such as the single premium immediate annuity (SPIA) can be competitively priced and still provide the primary benefit of annuities –guaranteed lifetime income. We also discussed the pros and cons of SWR strategies. These strategies can be designed and maintained with minimal fees using a do-it-yourself or robo-based approach with low-fee index funds (though we caution investors about these low fees in our article Index Investing: Low Fees but High Costs). However, we regularly see advisors charging excessive fees for managing these strategies. Moreover, some use more expensive funds and managers which increase costs further. Costs aside, there are some positive attributes of SWR strategies. For example, they typically only use liquid investments. Moreover, if one is willing to have faith in the underlying mathematical models and market performance (e.g., historical and Monte Carlo simulations), then SWR strategies are relatively simple for an investor to understand and execute. In our view, the primary downside of SWR strategies is their dependence on market performance. In particular, their success or failure hinges not just on the overall returns, but the path or trajectory the portfolio follows while attaining those returns. Given the fickle nature of market prices, we believe the market dependence of the SWR approach poses a significant risk to financial plans and retirement strategies. In particular, the current environment of historically low interest rates may represent a pivot point at which asset classes (e.g., stocks and bonds) start behaving differently. For example, we expect higher positive correlations going forward and this significantly dampen the performance of SWR strategies and result in lower terminal wealth and higher rates of wealth depletion. Our structured investment income (SII) strategy attempts to extract the core benefits of annuity and SWR strategies while addressing their cost and market dependency issues. In particular, SII targets the required income stream directly to both reduce the risk to retirement income and increase the likely amount of terminal wealth left for heirs and others purposes. SII also allows the capital to remain liquid and grow in the background but without the need to rebalance or extract synthetic income. The subtle but key strategic factor SII relies on to achieve these benefits is a transfer of risk away from the income stream and to the investment portfolio where it can best be rewarded with higher expected returns. Our simulation results illustrate precisely these benefits – a reduction in wealth depletion risk (a most dire situation to be sure) and maximization of terminal wealth to be shared with future generations, charities, and other causes. While these results make SII attractive relative to the other annuity and SWR approaches we highlighted, we find the intangible benefits of increased simplicity and transparency make SII an even more compelling option for those considering strategies for their retirement. |
Appendix: Overview of Annuities
Annuity products can range from straightforward to very complex. Some of the more complex products are marketed as a means of achieving a secured income stream and achieving tax deferral benefits. Below we provide a brief overview of some of the more popular annuity products and related features (riders).
| Note: Without doubt, the guarantees offered by many of annuity products are very valuable. However, it is critical to balance these benefits with what one pays for them – both via the explicit fees charged as well as the costs embedded in the features of the products. While we are not tax experts, we also recommend investors consider the potential impact of taxes |
Types of Annuities
Below we describe some of the common types of annuity classifications. This is not an exhaustive list and these categories are not necessarily mutually exclusive.
Immediate annuities: Exchange a lump sum of cash for a stream of cash flows that starts paying out right away. The length of the payouts can vary from a fixed number of years to the lifetime of you and/or your spouse.
Deferred annuities: Exchange a lump sum of cash (or a series of installments) for a stream of cash flows that starts paying out at a later date. These products effectively accrue the value of the cash payment(s) during the period before withdrawals start.
Fixed annuities: A fixed annuity contract pays a fixed or set rate of interest. In some cases, these fixed rates are minimums and may increase if future market conditions allow.
Variable annuities: A variable annuity contract invests proceeds in subaccounts that can fluctuate with the market. The subaccounts can range from low-risk cash or money markets to potentially riskier investments in the stock market.
Equity-indexed annuities: These are effectively a hybrid of fixed and variable annuities. The value of the contract is linked to a stock index (e.g., the S&P 500). On one hand, these are like a variable annuity except the money is not actually invested in a subaccount or fund. The value of the contract is also formulaically linked to the value of the underlying index. On the other hand, these are also like a fixed annuity since the insurance company will typically guarantee a minimum return. The investor will typically receive the maximum between the two (fixed or index returns).
Two-tier annuities: These annuity contracts maintain two rates of return or performance. One applies to monies held and owned by the investors and thus available for distribution. The second applies to those who annuitize their contracts. That is, they forfeit the cash value in exchange for a guaranteed steam of cash flows. The latter return is usually higher.
| Note: As discussed within this article, this higher rate of return may be illusory as the rate at which the value is converted into monthly or annual cash flows is just as if not more critical to what investors ultimately receive. |
Popular Riders
Below we describe some of the common types of annuity riders. This is not an exhaustive list and these riders may or may not apply to the various types of annuities described above. Some riders may be used in conjunction with others.
Cost-of-living: Annuity payouts can be linked to the rate of inflation as measured by an external index such as the consumer price index (CPI).
Cash refund: In the case where the value of the payouts is less than the contributions, the difference can be paid as a lump sum to the beneficiary. This guarantees the internal rate of return for the contract to be zero or greater.
Impaired risk: Annuity payments may be adjusted to reflect shorter life expectancies due to medical conditions.
Guaranteed minimum accumulation benefit (GMAB): Guarantees one’s account value up to (and perhaps more than) the amount of premiums paid into the contract net of withdrawals.
Guaranteed minimum withdrawal benefit (GMWB): Guarantees one’s withdrawals up to (and perhaps more than) the amount of premiums paid into the contract.
Guaranteed lifetime withdrawal benefit (GLWB): Explained in detail inside the article. This rider guarantees a minimum level of income for the rest of one’s life.
About Aaron Brask CapitalMany financial companies make the claim, but our firm is truly different – both in structure and spirit. We are structured as an independent, fee-only registered investment advisor. That means we do not promote any particular products and cannot receive commissions from third parties. In addition to holding us to a fiduciary standard, this structure further removes monetary conflicts of interests and aligns our interests with those of our clients. In terms of spirit, Aaron Brask Capital embodies the ethics, discipline, and expertise of its founder, Aaron Brask. In particular, his analytical background and experience working with some of the most affluent families around the globe have been critical in helping him formulate investment strategies that deliver performance and comfort to his clients. We continually strive to demonstrate our loyalty and value to our clients so they know their financial affairs are being handled with the care and expertise they deserve. |
Disclaimer
|
- Negative-carry refers to the cost of holding an asset. Stocks and bonds are positive-carry assets as one receives dividends and interest while holding them. Gold, oil, and other tangible commodities are negative-carry assets due to storage and insurance costs. ↑
- There is also a deferred version of this product: the single premium deferred annuity (SPDA). This product also converts a lump sum investment into a life-long stream of payments, but those payments start at a later date. ↑
- These payments are made by the insurance company but are further backed up by state guaranty funds (terms vary state by state). ↑
- Be careful not to confuse the Guaranteed Lifetime Withdrawal Benefit (GLWB) with the Guaranteed Minimum Withdrawal Benefit (GMWB). We explain this feature in the appendix. The key distinction is that the GLWB guarantees the series of minimum payments through one’s lifetime whereas GMWB guarantees the investor will be able to withdraw at least a minimum amount overall. The latter benefit may be exhausted before one passes. ↑
- There are typically additional fees to cover the underlying funds’ management fees as well as for mortality and expense fees paid to the insurer. ↑
- The actual figure depends on the withdrawals and market performance over the period. ↑
- The mortality and expense fee is charged by the insurance company to help cover fees related to managing and hedging longevity-related risks. ↑
- The two-tier label refers to the existence of two account values one annuity contract – one for the cash or surrender value (take your money and run scenario) and one representing the amount off of which annuitization would be based. ↑
- It is worth noting some advisors offer hourly rates or planning packages that can avoid potentially higher asset-based fees (i.e., fees calculated as a percentage of assets managed). ↑
- When we use the term natural income, we are referring to the actual dividends and interest paid by stocks and bonds. This is very different from the SWR approach whereby parts of the portfolio are sold off to generate synthetic income. We discuss this in detail in our article Destroying Steady Income Streams. ↑
- This math is straightforward. A 60% stock allocation within a $1,000,000 portfolio would invest $600,000 in stocks. If the current yield is 2%, that translates into $12,000 in dividend income per year. If dividends are cut 25% (note: we use 25% instead of the 23% decline during the credit crisis to keep number round), then this amounts to a $3,000 loss of income which is just 0.3% of the overall portfolio size (SPIA included). ↑
- We are not legal, tax, or estate planning experts. We always suggest consulting competent legal and tax professionals to assist with matters related to estate planning. ↑
- By similar we mean barebones, low-cost annuity – not any of the more complex options we discussed earlier. ↑
- When we speak of isolating, we are referring to the notion that while we might extract dividend income from the equity allocation, it is otherwise left to grow without a ceiling. SWR and other strategies based on maintaining 60/40 or other allocation targets require tapping into the equity portfolios to rebalance and restore allocations. ↑
- This of course depends on mortality tables but we have made these calculations many times and are yet to see implied fee levels on the order of bonds funds or other products. ↑
- A fee calculated as a percentage of assets. This is one of the most common fees with investments. ↑
- We are referring to equity and cash allocations specifically. Investors using bond ladders will generally be less liquid – though still more liquid than with an annuity. ↑
- There are options to sell ones annuity payments but it is not necessarily a straightforward process and the terms may not be favorable. ↑
- This is not always the case. One may select riders to provide a minimum number or amount of payments. If they pass before these are made, then their beneficiaries will receive the residual until the minimum is met. ↑
- These concerns are sometimes blown out of proportion. In reality, a large portion of annuity cash flows are just return of capital and this mitigates the impact of prevailing interest rates to some extent. ↑
- In the case of multiple annuities, it is generally sensible to purchase them from different insurance companies to diversify. As such, the annuity values may not be aggregated on any one statement. ↑
- Income taxes for those in higher tax brackets will be higher and potentially make SPIA and related products less efficient. ↑
- Near-cash investments refer to those that can easily be converted to cash with little or no risk of market loss. ↑
- Trailing 12-month dividends reached a peak of 342 (index points) at the end of 2008 but did not revisit that level again until the end of 2012. ↑
- In all cases we assume investments are managed sensibly as to consider potential tax-related costs. ↑
- Taxing cash flows as income can make these approaches less appealing for those in higher tax brackets. ↑
- We are skeptical of its relevance. Please read our Asset Allocation article for more information on this topic. ↑
- The historical database we use goes back to 1972. ↑
- We use 10-year treasury returns as a proxy for the bond portfolio. ↑
- Expert retirement researcher Wade Pfau’s paper discusses how lower asset correlations can lead to higher withdrawal rates and lower depletion risk. ↑
- Note: Depletion risk never goes to zero in reality as the stock market can go to zero in theory. We are simply stating that wealth depletion never occurred in the above historical simulations. ↑

STAY IN TOUCH!
Sign up for our research and updates.