| Many investors, investment professionals, and pundits make comments regarding the relationship between stock correlations and opportunities for active stock pickers. For example, it is not uncommon to hear comments like “Correlations between stocks are high right now, so it is difficult for active managers to perform”. They sound intuitive. We have heard and read these comments 1,000 times on TV and the internet. So they must be true, right? No.
I have had this discussion many times in person but never put pen to paper (or fingers to keyboard). However, I recently came across one of these comments from an investment professional who I deeply respect. Moreover, he is well-known for pursuing an evidence-based investment philosophy. So I figured it was time to set the record straight and write an article explaining why these types of claims are simply not true. I first try to make use of my math/finance PhD and delve into the formula. I realize formulas are not everyone’s cup of tea, so I try to translate my argument into plain English. I even built a spreadsheet you can download and play with. It shows how the numbers trickle through and contradict the notion of any relationship between levels of correlations and opportunities for active stock pickers. Just in case mathematical formulas are too confusing or not compelling enough, I also provide a separate and intuitive way to reason around these misguided assertions. |
Source: Aaron Brask Capital
The Formula
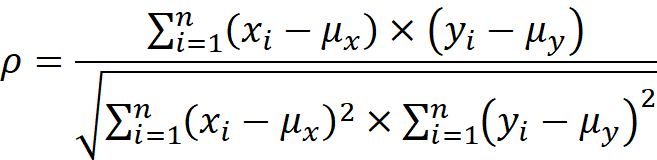
The first and most obvious (for mathematically inclined folks) way to illustrate the lack of relationship between correlations and opportunities for picking stocks is to examine the correlation formula directly (see Figure 1 on the front page). Notice that the mean returns of the assets ( and ) are subtracted from each of the data points (return observations). So no matter what the mean returns are, the correlation formula only looks at deviations from the mean. In other words, the correlation formula effectively ignores the mean returns of the assets. However, this is precisely what active managers picking stocks are targeting – how the assets end up performing overall. So there it is in one short paragraph. The correlation formula is basically useless for indicating opportunities for stock pickers.
| Note: You could stop reading here but I believe the following discussion is important in that it might help foster a sensible way to think about asset prices and returns. |
One might ask why the correlation formula subtracts out the means. To be clear, this is not a flaw in the formula itself; it is more an issue of how the formula is applied. When data is sampled from a larger population and analyzed (think of the heights of human beings), the population mean is the best guess for any individual observation (when randomly chosen). Moreover, the average of any sizeable sample of data points should be close to the population mean. So it is sensible to assume the mean of the sample is relevant.
| Note: Subtracting the mean within the correlation formula creates symmetry that results in some mathematically elegant properties. In particular, the calculation always falls between -1 and +1 and results of -1, 0, and +1 have specific interpretations. This makes correlation results very intuitive. |
However, the returns of financial assets are not independent random samplings from an existing population of returns. Stocks follow fundamentals over the long term. All else equal, returns in one period impact the distribution (e.g., mean) of returns going forward. In other words, the returns are not independent. For example, consider an asset that was expected to return +10% over the next year. If it jumped 20% in the first day, then the expected return would become closer to -10%[1].
My point with the above example is that subtracting a mean return from observed returns does not make perfect sense with asset returns since there is time-series dependence. So the mean would change through time. In practice, this may or may not have significant impact on the correlation calculation and this might just be nitpicking. However, it does not alter the primary point of the article; correlations are more or less useless when one is ultimately concerned with overall asset performance.
A Spreadsheet Illustration
Looking at and discussing formulas might give some folks a headache. So I built a spreadsheet to illustrate that assets can be 100% correlated but have significantly different returns. In particular, I used randomly generated numbers to simulate two stock trajectories. The simulation was designed so that the stocks were perfectly (100%) correlated. However, I created inputs for the expected returns and volatility for the stocks.
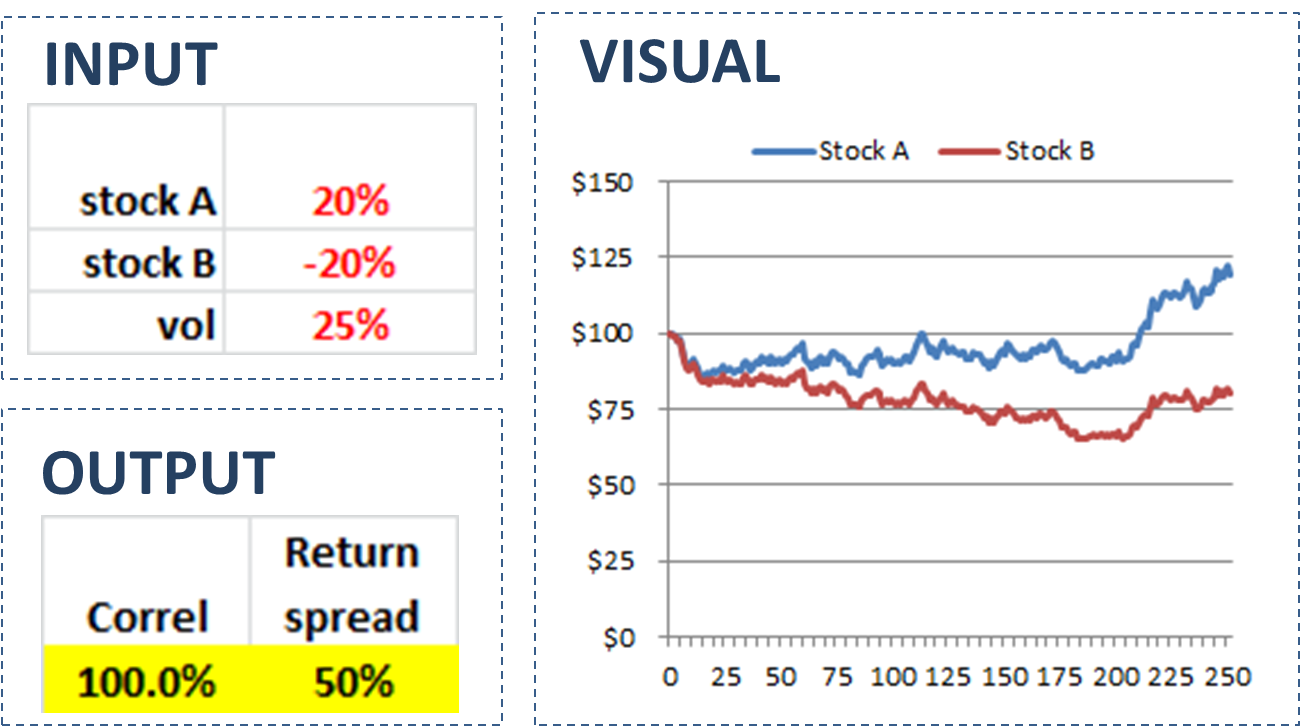
The spreadsheet contains four sections (three of which are depicted in Figure 2 below). The first section is for the inputs. You can enter expected returns for two stocks labeled A and B. You can also enter a figure for the expected volatility. If you hit F9, then the second section containing a table of simulated data (not shown here) will update.
In the third section for output you will see two figures. The first is the correlation of the two stocks. This will always be 100% by design. The second output figure will be the difference in the returns. This return spread will show the assets perform according to the expected returns (albeit with some random noise).
The fourth and last section is chart of the stock trajectories. As you will see, the stocks will move in the same direction on a daily basis, but eventually follow the paths as dictated by their expected returns. This illustrates my overall point; stocks can be 100% correlations but generate completely different returns.
Figure 2: Spreadsheet snapshots
Source: Aaron Brask Capital
One More Intuitive Perspective
I hope the above discussion and my spreadsheet have shown the correlation formula can be altogether useless when measuring the opportunity for stock-picking opportunities. However, I will offer one last perspective that will hopefully put a nail in the coffin of the misguided claims around this notion.
Let us consider the hypothetical scenario where stocks moved 100% lockstep. That is, every stock is 100% correlated and even has the same volatility. Interestingly, this would actually create opportunities for active managers because fundamental performance of stocks varies. In particular, lockstep price movements would pull some prices away from their fundamentals and thus create mispricing opportunities for active managers to exploit.
Interestingly, I would argue there are currently many rules-based strategies being employed that are impacting stock price trends including correlations. I discuss these strategies and their potential impact going forward in my Zombie Market Primer article.
About Aaron Brask CapitalMany financial companies make the claim, but our firm is truly different – both in structure and spirit. We are structured as an independent, fee-only registered investment advisor. That means we do not promote any particular products and cannot receive commissions from third parties. In addition to holding us to a fiduciary standard, this structure further removes monetary conflicts of interests and aligns our interests with those of our clients. In terms of spirit, Aaron Brask Capital embodies the ethics, discipline, and expertise of its founder, Aaron Brask. In particular, his analytical background and experience working with some of the most affluent families around the globe have been critical in helping him formulate investment strategies that deliver performance and comfort to his clients. We continually strive to demonstrate our loyalty and value to our clients so they know their financial affairs are being handled with the care and expertise they deserve. |
Disclaimer
|
- This assumes fundamentals have not changed. In the case of a 20% return, that may be unlikely (something might have changed). However, this is for illustrative purposes only and the same logic applies to smaller returns. The bottom line is that the expected return estimate would have to be updated after each observation. Admittedly, this is a subtle but interesting topic. However, it is not necessary to support the primary point of this article. ↑