| Imploration: The media regularly portrays pundits making predictions based on seat-of-the-pants interpretations of economic numbers, reported earnings, or market action. Right now much of the fodder for these analyses includes the calamitous events in Greece, China, and energy markets. Most of this is just sensationalism. While we do not generally advocate market timing and acknowledge the complications associated with doing so, we believe a better understanding of market dynamics can be helpful and sometimes be put to practical use. Accordingly, we ask that you please indulge us with some patience as we discuss the intuition, models, and data behind our forecasts. |
| The recent spate of volatility in the global equity markets has caused some uproar amongst investors, but it really should come as no surprise. For the avoidance of doubt, we expect significantly more volatility and correction. Spoiler alert: We expect markets to fall another 30% or more before this correction is finished.
Conventional wisdom assumes markets are mostly unpredictable – essentially just a coin flip. While this holds true for shorter periods, there is actually a very strong relationship between valuations and long term market returns. Unfortunately, the math is buried beneath so much volatility that few can unearth the real relationships. This article outlines a simple model for market valuations and compares it to historical returns. There is still some volatility around the results, but the correlations are impressively high – exceeding 0.90 for some metrics. After demonstrating their predictive power, we then put today’s elevated valuations into context. As the spoiler above indicates, markets are positioned for a very rough ride. The last section of this article addresses a very relevant question: What to do with this knowledge? Timing markets and making sensible portfolio adjustments is a real challenge. For example, there can be significant tax consequences (i.e., capital gains) when rebalancing portfolios. Moreover, investors’ behavioral psychology make it very painful watching bubbles grow from the sidelines. Admittedly, we find the challenges so great in many situations that we find inaction is often the best course of action. |
|
| Figure 1: Historical Valuations and Market Returns
|
Figure 2: Valuation and Market Return Distribution
|
Background
| Note: Readers familiar with the dynamics between markets, fundamentals, and valuations may wish to skip this section and start reading A Simple Model. |
Let us think of stocks as a collective of profit seeking entities that tend to succeed over time. Some do better than others, but in the grand scheme of things the lights stay on and a dynamic group of companies that make up the economy grow at a steady pace through time.
There is no ceiling for this growth. 225 years ago US GDP (gross domestic product is a proxy for economic activity) amounted to approximately $4.3bn in today’s dollars. The current figure is close to $16 trillion. Through a combination of real growth and inflation, the value of the collective economy grows through time.
In addition to the businesses that make up the real economy, there is a market that places price tags on those businesses – stock prices for individual companies and stock indices for broader segments of the economy. Linked to the magnitude of the underlying fundamentals, a chart of a stock market index also has no ceiling.
While the fundamentals are not without volatility, investors themselves introduce an additional layer of volatility when it comes to market prices. Some investors look at the fundamentals and attempt to determine appropriate prices at which they will buy or sell – this is valuation. Different models arrive at different prices. Other investors will not even bother to look at the fundamentals at all. At the end of the day, there are many different types of investors buying and selling companies for different reasons – investment, retirement, speculation, etc. – and the timing of their decisions varies according to their individual needs. The end result is a market comprised of many individual transactions that impose a greater degree of volatility in prices (i.e., market volatility) relative to the fundamentals.
| Figure 3: Fund Flows and Market Performance
|
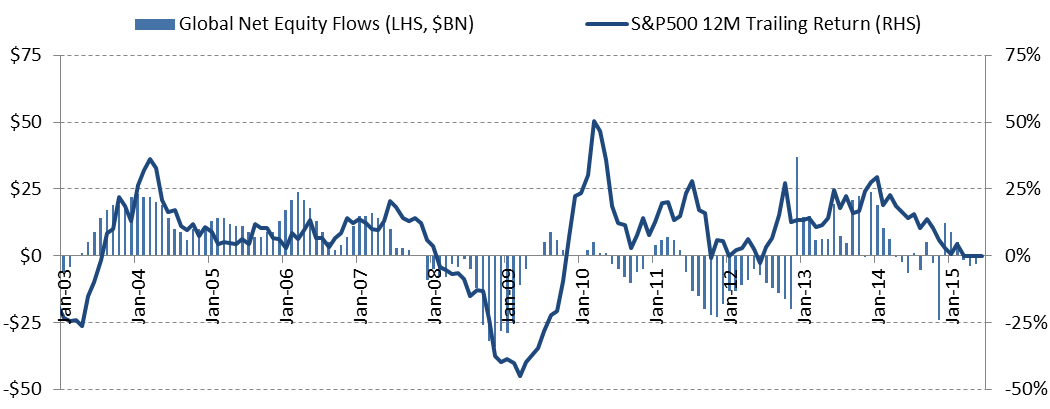 Source: Investment Company Institute (ICI) 2015 Factbook
A very important piece of the market puzzle is investor sentiment. Unlike computers, market participants are subject to waves of emotion and this impacts their investment decisions. When markets have been strong and the media is upbeat, investors tend to take more risk and buy stocks. Conversely, when performance slows or declines and the media turns negative, investors tend to take less risk and sell stocks. Sometimes the financial implications of an economic downturn force investors to sell (e.g., margin calls or need money for other purposes). Other times it is simply a loss of nerves and the market gets caught in a vicious cycle as selling begets more selling. A similar phenomenon occurs in bull markets too as the upward momentum increases risk appetite and pulls in more investors from the sidelines. Figure 3 shows the strong correlation between investor behavior and market performance.
This investor sentiment often pushes valuation (defined as the ratio of market prices to its underlying fundamentals) to extreme levels. Even steady blue chips are not immune. Coca Cola got caught up in the mania during the dot.com bubble. Exuberant investors pushed its P/E ratio well into the high 50s. Many of the same investors lost their nerve after the bubble burst and sent the stock plummeting almost 60% down from its highs to a sub-teens P/E ratio of 12. (Note: Earnings grew over the period so the price drop was proportionally less than the decline in valuation.)
To summarize, fundamentals and market levels are unbounded but valuations are mean reverting. They may go to extremes, but the price people are willing to pay for a company scales linearly with its fundamentals over the long term. New ceilings and new floors may be established for valuations in the futures, but history and logic provide much reason to trust they will continue to mean-revert.
This mean reversion of valuations is a critical factor when thinking about market returns. If the underlying fundamentals persist and grow steadily over long time periods but valuations mean revert, this means investors will experience higher returns during periods starting with low valuations and lower returns during periods starting with higher valuations.
| Figure 4: Illustration of Hypothetical Fundamental and Price Dynamics
|
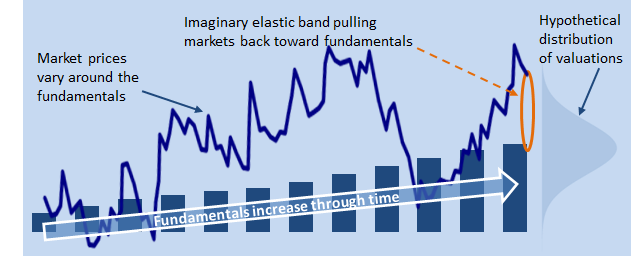 Source: Aaron Brask Capital
 Let us put it another way using a visual analogy. One can think of the economy as the sum of fundamentals of all companies (or perhaps just those defined by a specific market index). These fundamentals are unbounded and growing – the line that goes up in Figure 4 above. Then think of stock prices (or indices) as being loosely attached via an imaginary elastic band (valuation) to the fundamentals. Over the long run, investors will ride the growth in the fundamentals. Over shorter periods, the entry and exit points will impact their overall returns. In particular, purchasing companies at the lower (cheaper) valuations will capture both the fundamental growth and any increase in the valuation. Conversely, purchasing companies at the higher (more expensive) valuations will capture the fundamental growth but will be exposed to any valuation decrease. Similar logic applies to the point at which one sells.
Two related questionsHow far can markets go down?At the depths of a crisis, many businesses lose money and fail. However, the value of the fundamentals does not go to zero; there were always be physical assets, intangible assets, and human capital underlying those businesses. No matter how severe the economic downturn, survival instincts kick in and many businesses persevere while new ones sprout up. The situation in Germany after World War II is a great example. The country’s morale and asset base were decimated but Germany rebounded and eventually became the leading economic powerhouse in Europe. During these downturns, many of the stronger enterprises and value-conscious investors see the current and future value in those fundamentals and will typically acquire or purchase them when the price (valuation) is sufficiently attractive. They will put the assets of the weaker and defunct businesses to better use and increase their own growth. Fortunately, we have very transparent markets where asset values are recorded on publicly available balance sheets. This, in effect creates a lower bound at which others will come in to purchase cheap assets when they can buy them for less than the economic value they can generate. Different entities will place different values on those assets, but profit-minded businesses and investors will compete to purchase them. Even with vulture-like instincts, this competition should not allow businesses to trade far below the economic values of their assets for extended periods of time. In other words, price-to-book valuation ratios should not remain below one for long. How far can markets go up?This is a much tougher question. On the downside we can employ logic akin to purchasing dollar bills for less than a dollar. However, there is no obvious threshold on the up side. In general, the mindset that carries valuations far above their assets is not rational or objective. Accordingly, identifying a valuation level to associate with a market top would require the ability to predict irrational behavior. Just look at the heights market valuations during the credit crisis – even for non-tech companies like Coca Cola we highlighted above. The irrational behavior elevating prices above fundamentals is based off of different factors during each bubble. For the dot.com bubble, there was widespread belief that technology would make everyone more profitable (a silly thought when you think about competition and profit margins). Real cash flows and earnings were not necessary to value a company at $1 billion or even $100 billion. In the lead up to the credit crisis, it was commonplace to believe real estate only went up and leverage was always good. Everyone had the golden touch. Right now, the prevailing themes are typically along the lines of the Fed will support the markets if necessary or higher valuations are supported by low interest rates. We will discuss these delusions later, but the point is that there is no magic valuation level at which investors realize they are floating too high above the fundamentals. |
A Simple Model[1]
What fundamentals should we use to monitor corporate performance? Some investors prefer dividends as they can then apply a DCF (discounted cash flow) model to estimate a fair stock price. We find there is too much variability and flexibility in dividend policies on both a cross sectional basis (amongst different companies) and through time. While many like to use earnings and book value, we will use sales as our core fundamental metric here. It is simple, less amenable to accounting manipulation, and correlates well with corporate performance – both in theory and in practice.
| Figure 5: S&P 500 Aggregate Sales
|
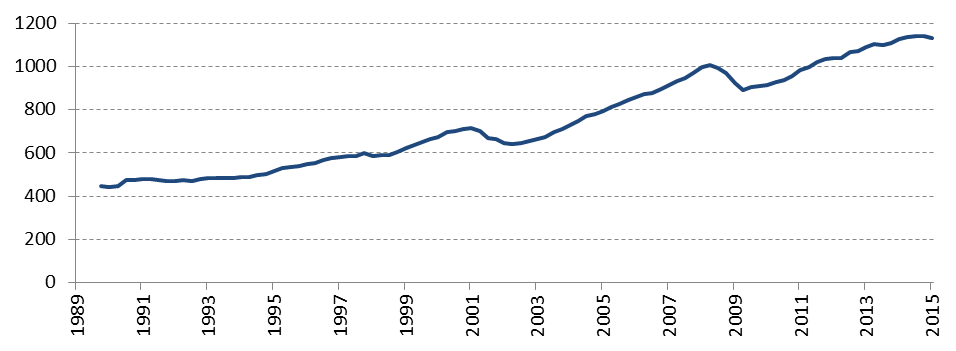 Source: Aaron Brask Capital
 We use historical sales and index prices to calculate the sales-to-price ratio through time. Note that we have sales in the numerator. The fundamental metric is often used as the denominator, but we prefer this yield-like version so higher (lower) figures correspond to more (less) attractive valuations and, in theory, higher (lower) returns going forward.
Figure 6: Sales to Price Ratio Source: Aaron Brask Capital Source: Aaron Brask Capital |
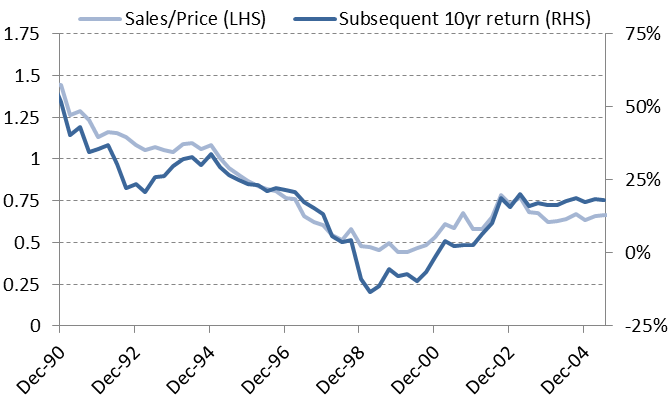
Based on 25 years of historical data, we compare the sales/price valuation metric to subsequent market returns. Using a 10 year price return, this valuation metric strongly correlates to future returns. Figure 7 shows they track very closely indeed. The correlation between the valuations and subsequent returns is 0.93. It is worth noting this correlation declines with shorter periods. The correlations for two and five year periods are 0.35 and 0.75, respectively.
Figure 7: Historical Valuations and Price Returns Source: Aaron Brask Capital Source: Aaron Brask Capital |
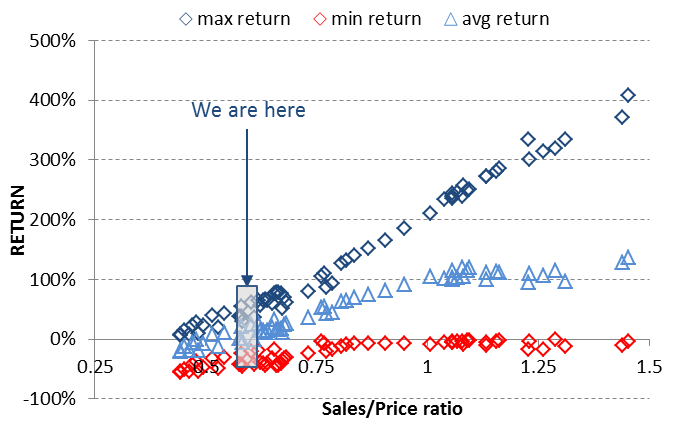
Figure 7 above only looked at the subsequent returns over periods of precisely 10 years. It does not provide any information about the distribution of returns throughout the 10-year periods. So for each period, we calculate three additional figures:
Minimum return: Lowest absolute return relative to the price at the start of the period.
Average return: Compares the average price throughout the period to the starting price.
Maximum return: Highest absolute return relative to the price at the start of the period.
Figure 8 below shows how the starting valuation impacts the subsequent highs, lows, and average returns the market experience over the subsequent 10 years.
Figure 8: Historical Valuation and Price Return Distributions (10 year return period)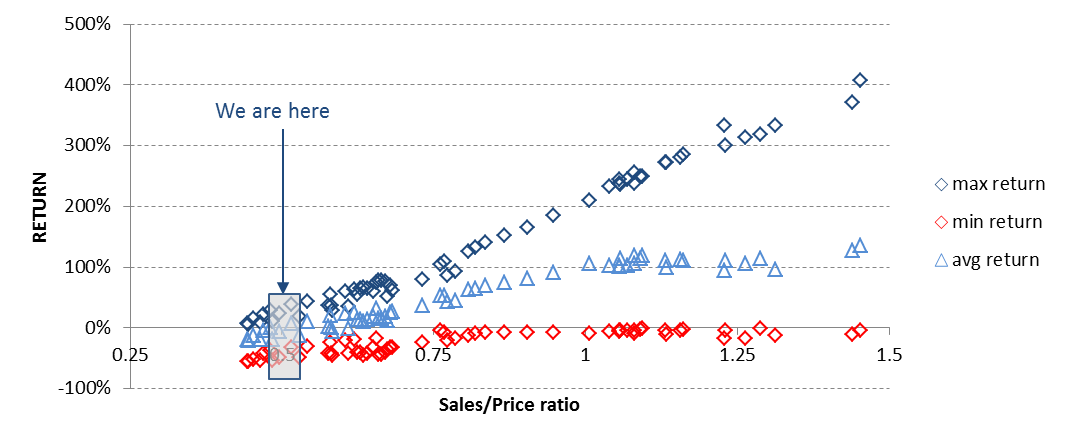 Source: Aaron Brask Capital Source: Aaron Brask Capital |
Unsurprisingly, each of the above lines has a positive slope. In other words, there is a clear trend whereby higher sales/price ratios leads to higher returns; better (cheaper) valuations are associated with less severe losses, higher average returns, and higher upside. Similarly, more expensive valuations are associated with more severe losses, lower average returns, and less upside.
While our database does not extend back beyond 1989, we point readers to other analyses conducted using more historical data. For example, Hussman Funds shows a variety of valuation metrics and their relationship to subsequent returns[2] with data going back to the 1940s. The data make clear a strong correlation between valuations and market returns.
Implications Going Forward[3]
Now that we have identified a strong relationship between valuations and long term price returns, we now look at what current figures indicate for future returns. In the context of Figure 8 above, we are sitting on the far left end of the spectrum. Figure 7indicates that valuations are now more expensive than they were going into the credit crisis and almost as bad as they were at the heights of the dot.com bubble. Valuations are not attractive. This will have strong implications for the returns we experience going forward.
In the 25-year history we looked at, sales/price levels of 0.55 or lower were always associated with market declines of at least 30% over the subsequent 10 years. We do not expect anything different this time around. The average decline when starting from valuations of 0.55 or lower was -46%. In other words, history implies current market valuations will lead to significant losses in coming years.
The timing of such losses is very difficult to pinpoint. Make no mistake, valuations often remained extended for years. Notwithstanding, we present several technical signals currently indicating investors are becoming more risk averse. While none of these are 100% accurate on their own, the fact that they are all indicating a turn to more negative sentiment is more compelling to us.
Figure 9: 200 Day Moving Average Source: Aaron Brask Capital Source: Aaron Brask Capital |
- Recent breakdowns of correlations: Over the past two years we have witnessed distress in Greece, our energy markets, and most recently China. Interestingly, energy experienced similar declines before the equity markets corrected on the back of the credit crisis. The broader equity markets have all but ignored these factors and sit near their multi-year highs.
- NYSE[4] margin debt: The amount of money borrowed to purchase stocks on the NYSE is teetering around all-time highs and its most recent move was down. This indicator represents speculative money and Figure 10 illustrates its strong correlation with markets.
- 200 day moving average (DMA): This is a widely used metric amongst technical analysts and momentum funds. Figure 9 shows the history of the S&P500 200DMA. In particular, we highlight the areas where valuations were most expensive (top quartile) and the 200DMA crossed below market levels.
- Market imbalances: There were several instances of market imbalances in recent weeks. For example, the S&P 500 was down almost 8% on the market open Monday August 24th. On the close of the following day, the S&P 500 fell more than 3% in the last hour of trading. Large trading volumes at the start and end of the days are generally institutional investors (mutual funds, hedge funds, etc.). We believe funds based on technicals like those above will be reducing risk going forward. Selling will likely lead to more selling. This includes momentum funds as well as the new risk-parity funds.
Figure 10: NYSE Margin Debt and the S&P 500 Source: Aaron Brask Capital |
Admittedly, we might have expected the issues in Europe, especially with Greece, might have been enough to sway investors toward caution. However, it seems there are widespread beliefs that assume central banks can fix economies and markets. We do not believe in any such magical abilities. Instead, we expect their efforts to at best only postpone or redistribute the problems through time. Moreover, when central bank intervention distorts the market pricing mechanisms (e.g., interest rates), capital gets allocated based on non-market information and often results in mal-investment. This is likely the primary driver of the elevated valuations we currently see in equity markets. More and more investors have found little comfort in the scant interest rates associated with many lower risk investments and have allocated more to stocks.
The recent declines in China are likely indicative of how futile government and central bank efforts can be in the face of investor risk aversion. It seems as if few recall the US Fed was easing during both the bursting of the dot.com bubble as well as the credit crisis. What is worse is that there are no more bullets left in this gun with the Fed Funds Target at still at 0.25%. We can never be sure but we strongly believe the technicals cited above are indicative of a tipping of the scales as an increasing number of investors decide the balance of risk and reward in the stock market is not favorable.
Figure 11: Fed Funds Target Rate Source: Aaron Brask Capital Source: Aaron Brask Capital |
What to Do with this Knowledge?
In a nutshell, we recommend sensibly reducing or minimizing equity risk where possible. This could involve trimming allocations to stocks or ensuring the businesses underlying your stocks holdings are strong enough to withstand some economic volatility. It is almost ironic the market is currently pricing high quality businesses cheaper than more speculative enterprises. In reality, it is not ironic; it is simply symptomatic of the valuation-insensitive behavior that has brought us to this point.
We acknowledge implementing this advice is not straightforward. In particular, many portfolios have embedded capital gains after several bull market years. As always, one must carefully consider the tax implications of adjusting or rebalancing any positions (Note: We generally like to own individual securities instead of funds so that we have more flexibility to net gains with losses.) In any case, the total economic impact from rebalancing must be considered; this includes taxes, transaction costs, etc.
Another complication with reducing equity exposures is many investors find it painful to watch markets rise from the sidelines. Markets may continue to climb higher – possibly reaching or exceeding valuations during the dot.com era. We cannot rule this out. Reducing stocks market exposure is further complicated by the decision of when to get back into the market. One must plan and exercise strict discipline or the end result could be horse than riding out the storm.
Again, timing markets is a very difficult challenge. A well-known rule of thumb is market timing is too difficult and complicated to implement successfully. We agree with this in general. However, there are still many who are inclined to attempt to time markets. Moreover, there are many investors whose situations are more amenable to it than others. For example, investors with carryover losses, unrealized losses, or tax-deferred accounts may have less tax consequences to worry about. Moreover, those looking to invest idle cash might consider slowing the pace at which they are putting their money into the market.
On balance, one must objectively assess their personal situation, associated costs, and risk profile. This should include but not be limited to the above factors. Buy-and-hold portfolio owners should make sure they can tolerate significant volatility. Jumping out after markets have corrected is the perfect recipe for disastrous returns. Given the challenges associated with this strategy, in many cases inaction will be the best action. We strongly suggest consulting with an investment professional before making any investment decisions.
About Aaron Brask CapitalMany financial companies make the claim, but our firm is truly different – both in structure and spirit. We are structured as an independent, fee-only registered investment advisor. That means we do not promote any particular products and cannot receive commissions from third parties. In addition to holding us to a fiduciary standard, this structure further removes monetary conflicts of interests and aligns our interests with those of our clients. In terms of spirit, Aaron Brask Capital embodies the ethics, discipline, and expertise of its founder, Aaron Brask. In particular, his analytical background and experience working with some of the most affluent families around the globe have been critical in helping him formulate investment strategies that deliver performance and comfort to his clients. We continually strive to demonstrate our loyalty and value to our clients so they know their financial affairs are being handled with the care and expertise they deserve. |
Disclaimer
|
- Please note that we have used price returns throughout our analysis. We have not included nor reinvested dividends. ↑
- http://www.hussmanfunds.com/wmc/wmc140414.htm ↑
- We used price returns in our analysis. That is, we do not include dividends or dividend reinvestment into our return calculations. ↑
- NYSE = New York Stock Exchange ↑