“The Devil’s best trick is to persuade you he does not exist” – Charles Baudelaire[1]
| Many investors and investment professionals are aware of the cost/performance issues within the actively managed mutual fund industry. This has provided a significant boost to index investing and exchange traded funds (ETFs). Virtually everyone knows about the low fees and index-like performance; it is a very compelling story relative to higher-cost mutual funds that underperform their related indices on average.
Looking deeper into the mechanics of index investing, however, reveals subtle but real costs that can far outweigh the advertised management fees. In some cases, these costs can be 2% or more per year and should thus be considered when deciding on or formulating investment strategies. |
There is a tremendous body of academic and practitioner research analyzing mutual fund cost versus performance. Virtually every study comes to the same conclusion: mutual funds underperform on average due to their higher fees. Likewise, there is much research espousing the positive attributes of index investing and exchange traded funds (ETFs). We will not rehash these topics here.
This article brings to light several lesser-known issues with index investing not often discussed in media or research circles. Whether this lack of attention is due to the subtle or technical nature of these issues, they are real and can impose performance drags on the order of 2% or more per year (significantly higher than the advertised management fees). The investment performance of those who ignore (or are simply unaware of) these issues may unnecessarily suffer as little effort is required to avoid or mitigate the associated performance drags.
Figure 1: Estimated Performance Drags Related to Index Investing
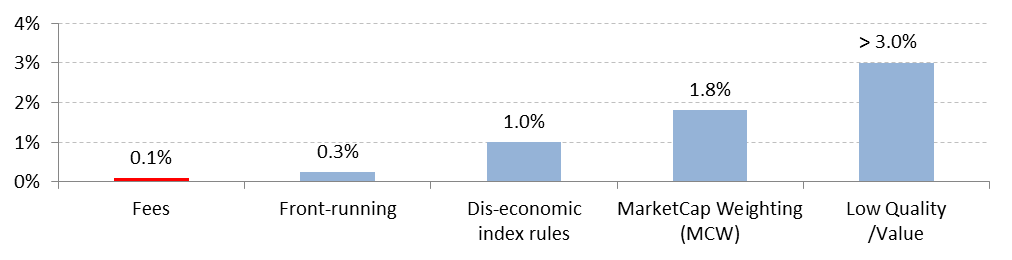
Source: Aaron Brask Capital
| Note: While this article focuses on several negative attributes of index investing, we are in no way condemning the approach. Index investing provides a great opportunity for investors to avoid the higher costs and sub-par performance associated with actively managed mutual funds. The goal of this article is to make investors aware of the negative attributes of index investing so they can make informed investment decisions. |
The following sections discuss four specific issues related to common indexing strategies. Each section describes the issue, why it exists, and proposes solutions to mitigate or avoid it.
Index Issue #1: The Good, the Bad, and the Ugly
John Bogle (founder and retired CEO of Vanguard Group) and others make a strong case for broad-based index funds. In his “The Little Book of Common Sense Investing”, Bogle argues an investor can easily take a slice of the entire market to participate in the profits and progress of a given economy. This approach has strong merits – especially when measured against the active mutual fund industry. However, broad-based index strategies invest in companies with no regard for quality or valuation. Anyone employing such a strategy invests in the good, the bad, and the ugly.
There are many academics and practitioners who argue it is impossible to distinguish between high and low quality companies. They say the same about determining what companies are cheap or expensive. They claim high quality businesses attract more competition and are thus prone to deteriorate. They also cite the classic efficient markets hypothesis (EMH) theory – essentially assuming prices reflect all publicly available information. This theory condemns stock picking as a futile exercise. No matter how intuitive these claims may sound or how elegant the theories are, the historical record does not support them.
 Source: Aaron Brask Capital
In the summer of 1974, Dr. Kenneth Carey published an article titled “The Persistence of Profitability”. As the title indicates, Dr. Carey went on to show how higher quality companies – those with higher profitability – sustain through time. His research analyzed data over the period from 1963 to 1972. Almost 40 years later, a June 2012 paper by Grantham Mayo van Otterloo (GMO)[2] analyzed fundamental data going back to 1965. They again presented convincing evidence demonstrating the persistence of high quality companies. In particular, companies with higher historical profitability experienced higher profitability in the future. These results were consistent throughout the 50-year period and included multiple business cycles.
One key observation from the GMO research was the profitability amplified divergence between higher and lower quality companies during periods of stress. That is, lower quality companies suffered more significant setbacks during these periods. The bottom line is that the above academic theories fail to recognize the concepts competitive edges and brands (or economic moats as Buffett would say). Quality companies tend to persist.
The above analyses only considered corporate fundamentals. That is, they did not indicate whether this phenomenon translated into improved investment performance. Gray and Carlisle[3] did precisely this. They showed that filtering for quality businesses could significantly improve investment performance by analyzing data on large stocks from 1964 to 2011. While all four of the definitions they used for quality led to improved performance, the profitability metric outperformed the market by more than 2% per annum.
These results are remarkable for at least two reasons. First, the blue-chip (large) stock universe is typically assumed to be a higher quality universe already. This sets the bar higher for distinguishing between degrees of quality. The second reason is this quality approach ignored the price paid (i.e., valuation). All else equal, one might expect higher quality stocks to be more expensive and deliver lower returns based on having lower risk. This is a core premise of the Capital Asset Pricing Model (CAPM). However, that was not the case as the results indicated the opposite was true. Investors do not necessarily have to pay more for quality companies. Perhaps this is why Warren Buffett avoids the “cigar butt” approach whereby investors purchase lower quality companies:6
| “A cigar butt found on the street that has only one puff left in it may not offer much of a smoke, but the bargain purchase will make that puff all profit. Unless you are a liquidator, that kind of approach to buying businesses is foolish … the original bargain price probably will not turn out to be such a steal after all.”
– Warren Buffett (Berkshire’s 1989 letter to shareholders) |
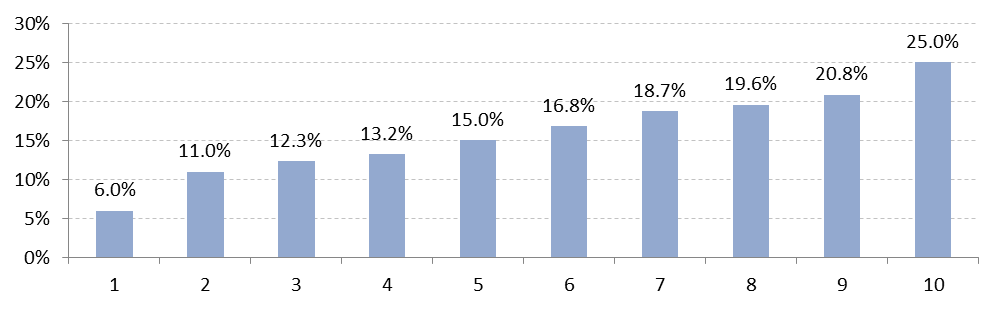
In terms of identifying cheap or expensive companies (i.e., valuation), Professors Eugene Fama and Kenneth French are generally acknowledged as having written the seminal paper on the topic. Their 1992 paper “The Cross-Section of Expected Stock Returns” presented convincing evidence that valuations displayed a consistent ability to predict stock returns throughout history. In particular, avoiding companies with higher valuations increased returns. Their research showed removing the bottom quartile of companies with the highest valuations improved annual returns[4] by approximately 2% per annum while avoiding the bottom half of companies with the worst valuations improved returns by over 4%. These magnitudes of improvement are significant indeed.
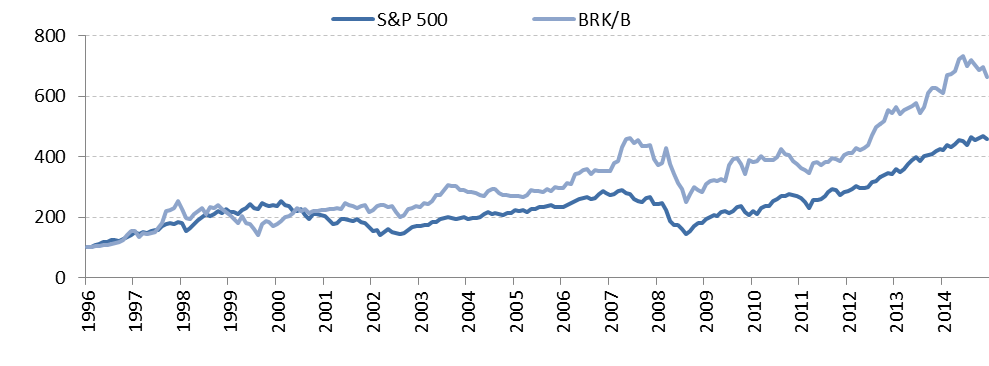
Just as with Berkshire Hathaway’s stock, there were naturally periods in which low-valuation companies underperformed. However, the results were statistically significant and impressively consistent over longer periods. Their paper sparked much interest in the topic and resulted in numerous other papers and investment strategies substantiating their findings across time periods and geographies.
| Figure 3: Fama-French Average Returns (Annualized) Per Valuation Decile
|
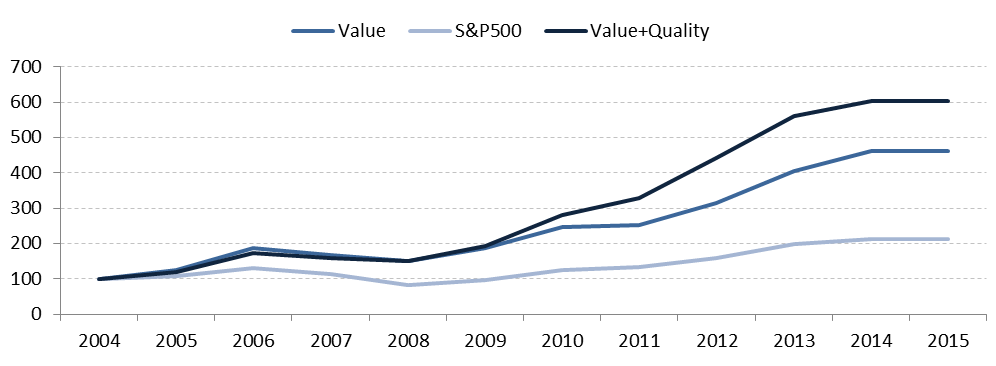
While legendary investor Joel Greenblatt rose to fame within investment circles due to his stellar track record[5], his books on investing over the years have made his name familiar to more investors through the years. His most recent books[6] focus on a simple model he calls his Magic Formula that is based on a combination of quality and value. He showed the combination of these two factors could be even more powerful than either on its own. Intuitively, the quality factor weeds out many of the cheap companies that perhaps deserve the low valuation (Buffett’s cigar butts?). Greenblatt showed that companies with a favorable balance of value and quality outperformed the market even more significantly than value alone.
Figure 4: Greenblatt’s Quality and Valuation Magic Formula
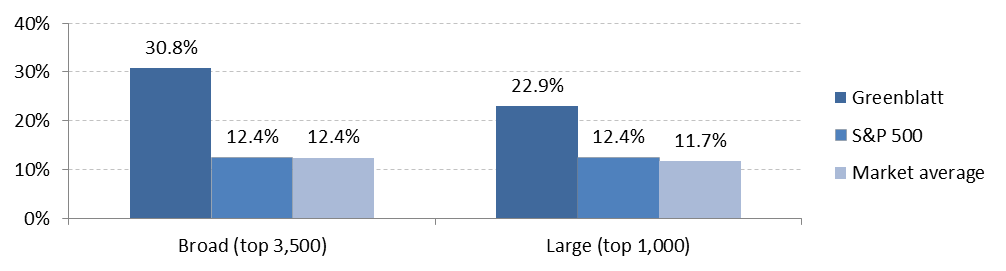
Source: Aaron Brask Capital
For example, in his “The Little Book that Still Beats the Market”, Greenblatt analyzed the largest 3,500 US companies and showed the combined quality/value approach generated returns of 31% versus the market’s 12% over the period from 1988 to 2004. Focusing on just the top 1,000 companies narrowed the gap but still yielded impressive results as his quality/value approach generated annualized returns of 23%. Unlike some of the academics who argue such strategies are based on luck, Greenblatt has the enduring track record to back up his claims.
We conducted our own research on quality and value factors over the 10 year period ending June 30, 2015. Using a universe based on the largest 3,000 companies at each point in time, we ranked stocks by quality and value. We first identified the top 500 quality stocks in each period. Figure 5 shows approximately 70% of the quality stocks persisted from each year to the next with very little deviation. Moreover, many of the companies that fell out came back in later. If the 30% of new quality companies each year were always different, then there would be a total of approximately 1,850[7] unique quality companies throughout the ten year period. However, there were just 1,449 unique companies which effectively indicate quality persistence was really closer to 80% each year.
Figure 5: Quality Persistence Amongst Largest 3,000 US Companies
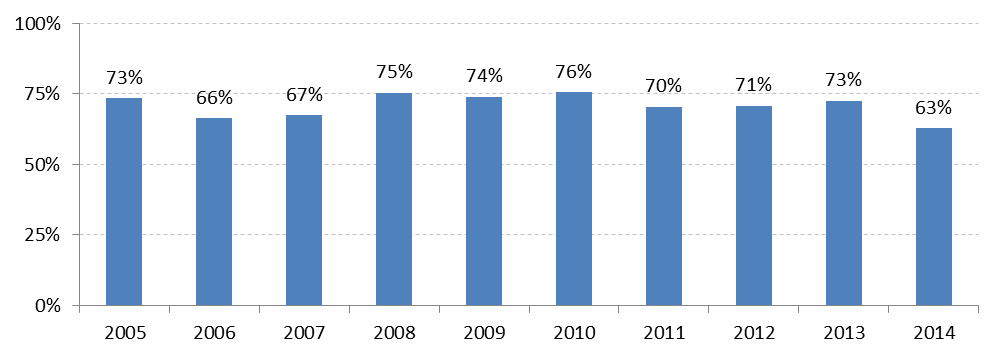
Source: Aaron Brask Capital
We also analyzed the value factor over this same period. In particular, we identified the top companies by valuation and compared their performance to the broader universe. Our value strategy yielded excess performance almost identical to Greenblatt’s. We removed most (2,500 of the 3,000) of the higher valuation glamour stocks (a.k.a. growth stocks), performance increased by approximately 10% per year – 17.8% versus 7.8% for the Russell 3000 index. Note: While this analysis does not account for transaction costs, integrating even the most extreme conservative assumptions[8], this value strategy would have still outperformed by multiple percent per year and resulted in significantly higher overall gains (approximately 40% more gains than the index and 20% more terminal wealth).
With the benefit of hindsight, everybody would like to have purchased Microsoft in 1986 or Google in 2004 while they were more speculative enterprises. Indeed, there are many companies that amassed incredible returns over the years. While you know many of these names, what you might not see or recall is the long list of other failed enterprises. This is a simple matter of survivorship bias and it breeds hope for finding next big winner. When one works out the numbers, quality trumps hope and it generally makes sense to avoid investing in companies that resemble over-priced lottery tickets.
Figure 6: ABC Quality and Valuation Performance Impact
Source: Aaron Brask Capital
| Note: One question often surfaces in the face of such compelling data: Why don’t active mutual funds do this? One answer is that emotions come into play. Fund managers mentally override objective data due to various behavioral biases. It is indeed difficult to buy something nobody else wants and risk potential ridicule. However, the more widely accepted reason is linked to incentives and job security. Even if a strategy works in the medium to long run, it can underperform over shorter periods of time. These periods of underperformance can jeopardize the jobs of fund managers. Accordingly, they have a strong tendency to stick close to the index to minimize this risk. This phenomenon has become so commonplace that the industry came up with a label for managers who do this: closet indexers. Interested readers will appreciate Nobel Prize winner (psychology) Dr. Daniel Kahneman’s book Thinking, Fast and Slow where he discusses the behavioral biases that contribute to this phenomenon and shares his research on the topic. |
Solutions
Many ETF/index providers offer products that embed a quality factor. While we believe this is better than nothing, we have a few issues with this approach. The first and most important issue is how each vendor defines quality. Some quality metrics are better than others. Even if the quality metric is good, most ETFs and indices focus on a single factor and thus miss out on the benefits of the combined quality/value approach. We find that combining factors is the best approach – albeit not necessarily via the standard multi-factor regression approaches most use.
In addition to quality-based ETFs and indices, one may also impose quality screens to formulate their own portfolios directly (again, make sure you do not overpay by integrating a value metric). This could be something as simple as screening for companies with consistent and/or rising dividends. It could also be something more complex like Dr. Joseph Piotrowski’s multi-dimensional Fundamental Score. While our proprietary value and quality metrics are based on simple intuition, our implementation is slightly more sophisticated as our models address issues relating to non-linearity and multi-dimensionality.
There is much media and content addressing these topics. I recommend reading O’Shaugnessy’s What Works on Wall Street and Gray and Carlisle’s Quantitative Value for those who are interested in these topics. While their modeling is limited to standard metrics and backtesting, these two books both do an excellent job of exploring the effectiveness of various factors including but not limited to quality and value.
Index Issue #2: Front-running
Index front-running, sometimes referred to as index arbitrage[9], refers to the practice whereby hedge funds and professional traders buy and sell stocks (or bonds) before they are added to or deleted, respectively, from an index. While few people have been aware of this issue historically, the investment community is increasingly becoming aware of this problem as it warrants more attention. Indeed, the increasing number of assets following index strategies actually works out to the detriment of index investors as the increased trading flows from index changes creates more opportunity for index arbitrageurs.
An index is really just a set of objective rules for managing a portfolio of stocks. For example, the S&P 500™ index comprises the largest 500 stocks by market capitalization[10] trading on US exchanges. When companies grow and earn their way into this index, they displace other smaller companies who exit the index. Moreover, when one company acquires or spins off another, it does not become the S&P 499 or 501; the index has rules for how and when it rebalances itself.
Figure 7: Estimated Front-running Costs Versus Fees for S&P 500 Investors
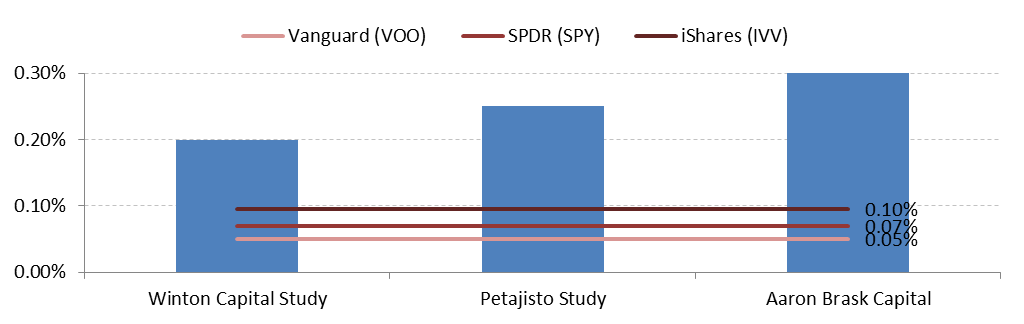 Source: Aaron Brask Capital
Index rules are published for all to see. They spell out precisely how and when an index will rebalance. This transparency has a cost, though. Professional index arbitrageurs in banks and hedge funds work out what companies are likely to go into and out of the index. They identify the companies where the most dollars will be flowing in or out based on their estimates of how much index funds will have to buy or sell. Given the index funds must buy and sell around particular dates, these traders buy and sell ahead of the index rebalancing. This process elevates the prices of companies going into the index and dampens the prices of those going out – effectively manipulating the index to the detriment of the index investors.
In some cases, index portfolio managers make deals with banks or hedge funds to transact at the closing price on the day an index rebalances. Naturally, if trillions of dollars are benchmarked to various indices, then they cannot all execute trades at the close of the bell on the rebalance days. They need to spread the liquidity across a wider window. In this sense, these index arbitrageurs are providing a service to index investors, but it has a cost as the net result is still negative for the index investors.
A 2014 study by Winton Capital[11] estimates the impact of front-running for the S&P 500 costs investors at least 20bps (0.20%) per year. Their study analyzed data from 1989 to 2014. Given this index is one of the lowest turnover indices around and its constituents are highly liquid, the impact is likely greater for most other indices.
Antti Petajisto published an earlier (2008) article in the Journal of Empirical Finance[12]. His study analyzed data from 1990 to 2004. His results corroborate the Winton Capital Study and support the notion of higher impact in other indices. He estimated the impact for S&P 500 investors was 21-28bps annually and 38-77bps for Russell 2000 investors.
We conducted our own study[13] of the S&P 500 index in 2011 analyzing data from 2000 through 2009 and concluded the front-running impact to be on the order 10% of index turnover. For example, if turnover was just 3%, then we estimated front-running costs of 30bps (10% x 3%). If turnover was 6%, then we estimated front-running costs of 60bps (10% x 6%).
Even for the highly liquid, low-turnover S&P 500™ index, the impact of front-running imposes a performance drag that is likely greater than 20bps. This far exceeds the advertised management fees – often in the single digit basis points (Figure 7). For indices that have higher turnover and/or less liquid constituents, front-running will likely have more negative impacts. As index-based investing sustains or grows, it will only create more opportunity and attract more index arbitrageurs that will likely increase the negative impact of front-running.
The financial services industry is scrambling to address this problem by creating new indices that attempt to avoid or mitigate this front-running issue. However, the simple fact is the transparency of index rules will not likely go away as it would make benchmarking significantly more complex and open the door for unscrupulous managers to deviate from their mandate. At the end of the day, investors and investment professionals should be aware of these issues and make an effort to minimize their negative impact.
| Note: Upon explaining this phenomenon in the past, many have associated this type of index arbitrage activity with insider trading. It is not insider trading and it is completely legal. Insider trading refers to corporate insiders who are aware of private information and use it to benefit themselves or others by trading that company’s stock before the information is made public. Index arbitrage relies on publicly available information – index rules. Luckily, the investment industry is creating new and innovative solutions to mitigate these issues (discussed below). |
Solutions
One way to mitigate the front-running issue is to use funds with minimal turnover. The standard large company, broad market, market capitalization weighted[14] indices typically have the lowest turnover. Given that size is the sole factor in their construction, no other factors will move companies in or out of the index. For these indices, much of the turnover occurs as the result of M&A activity or in the tail end of the index where smaller companies fall out or jump into the index. Total market indices minimize this as the tail end of these indices comprises an even smaller weight and thus results in less turnover. For reference, the S&P 500 and Russell 3000 indices have experienced historical turnover on the order of 3-6% per year and the broader total market indices were around the 1-3% range.
Another way for investors to mitigate front-running impact is by investing in product based on less popular indices. Indices with less assets benchmarked to them will attract less attention from index arbitrageurs since there will be less volume related to the rebalances. However, less popular indices typically do not last as it costs money to maintain an index and index providers are in the money-making business.
The last strategy we highlight to deal with index front-running is managing portfolios directly in private accounts or SMAs (separately managed accounts). These accounts can be passively managed according to rules of any given index, but sensibly avoid the above issues by rebalancing at different times. Given the right resources and experience, this can be done by an individual investor or family office member. It is worth noting some investment companies offer low-cost passive strategies to mimic indices but attempt to trade around this or other issues. Naturally one must always weigh the costs (i.e., salaries or management fees) against the benefits. That is precisely why we are highlighting these issues and estimating their impact.
Luckily, investors are not alone in combatting the front-running issue. Index providers attempt to mitigate turnover via various methodologies. One is the use of buffers or bands. Stocks hovering around a cut-off point do not automatically join or exit an index. Instead, they must exceed or fall below the threshold by a certain amount (i.e., a buffer) before joining or exiting the index. This raises the bar for index changes and thus reduces turnover and front-running.
The Center for Research in Security Prices (CRSP) has developed indices that make the rebalance dates less certain. This makes the job of index arbitrageurs a little more difficult. Vanguard, always on the lookout for ways to lower costs and improve performance for their investors, converted many of their funds’ benchmarks to CRSP indices in 2012.
Dimensional Fund Advisors (DFA) follows passive rules but with the flexibility to intelligently handle issues like this. Given the lack of transparent rules for their funds, index arbitrageurs cannot front-run their trades. However, there are some who argue that the added flexibility moves their approach into the active management realm and cannot be compared with passive or index-based approaches.
Index Issue #3: Market Capitalization Weighting (MCW)
Market capitalization weighting (MCW) refers to the practice of weighting the constituents in a stock index proportional to their market capitalization[15]. For example, bigger companies like Apple, Microsoft, Exxon Mobil, and Johnson & Johnson will have much higher weights than smaller companies in MCW indices.
One of the primary benefits of this approach is low turnover. The weights of companies scale with their stock prices and thus do not require rebalancing as prices move around. One of the primary disadvantages cited with MCW indices is that they are top heavy; the largest holdings dominate index performance and minimize the contribution from smaller companies. Given the historically superior performance of smaller companies, some point out it is almost counterintuitive to weight portfolios in this manner. While these issues are real and we agree with them to a large extent, they are already well known and often discussed.
Our issue is much more subtle and relates to the MCW’s reliance on what the market thinks companies are worth (i.e., their share price) to determine their weights. Market prices are notoriously volatile and we know the market is not always right; some companies are overpriced and some are underpriced. Even the most dogmatic academics acknowledge the stock market is not 100% efficient.
Relying on market prices to determine stock allocations systematically over-weights overpriced stocks and under-weights underpriced stocks. This is effectively an anti-value tilt to the portfolio and it can significantly dampen returns. So how does this happen? Even if we assume it is impossible to identify which companies are overpriced and which are underpriced, we know they are there. So for each overpriced company, a MCW index will assign it a higher allocation than if it were not overpriced. Conversely, each underpriced company will be assigned a lower allocation. All else equal, the overpriced stocks will experience lower returns and underpriced stocks will experience higher returns (the very premise of value investing). So the MCW index will systematically dampen returns over the long term by over-allocating to overpriced stocks and under-allocating to underpriced stocks.
Figure 8: MCW Mispricing and Weighting
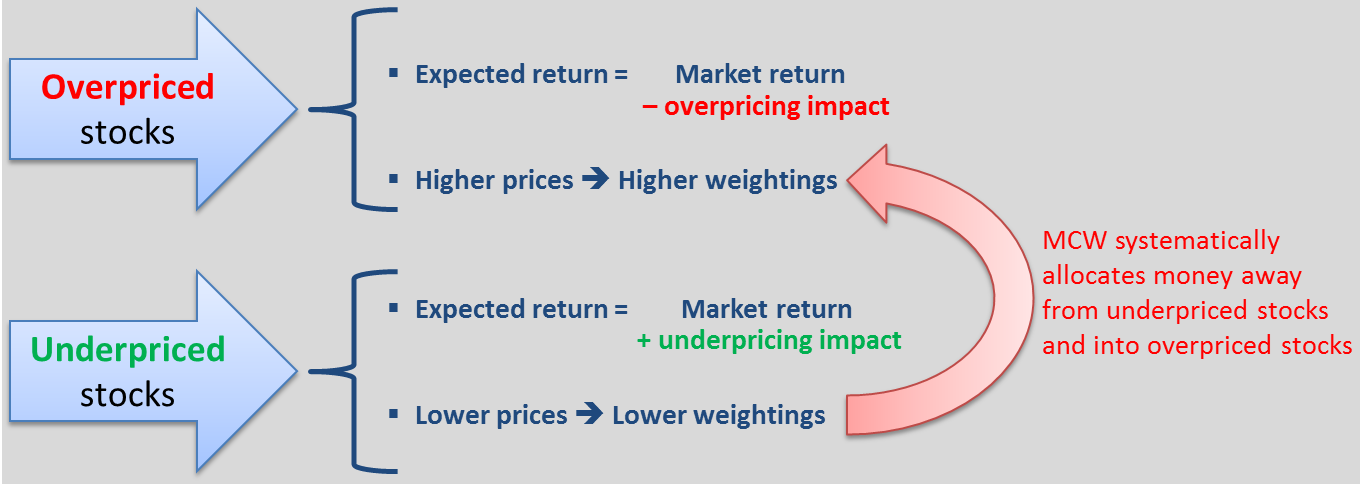 Source: Aaron Brask Capital
This is a very significant but subtle issue, so we will use three examples to illustrate the point. Our first example is hypothetical. Let us think of a universe in which all companies are the same (size, growth, etc.) and thus deserve the same price – say $1 per share. Let us also assume these companies will grow in such a way that their share price should be $4 in 20 years (approximately 7% return annualized). If for any reason one company is out of line with the others (e.g., temporary buying or selling pressure), then a MCW index will reflect the price discrepancy in the weight it allocates to that stock. If that company is trading at $2 per share, then its overpricing will be rewarded with double the allocation relative to the other companies (trading at $1). This company will double in the next 20 years (going from $2 to $4) but its overall return will be around 3.5% – just half the return of the rest of the market (where each company appreciates from $1 to $4). Investors should naturally prefer to minimize their exposure to the overpriced stock in this scenario. However, MCW indices will actually increase their exposure to it and thus reduce their future returns.
Our next two examples are not hypothetical. Here we compare the historical performance of a standard MCW index to another index that uses fundamental data (i.e., data from financial statements) instead of market-based proxies for size to determine the weights. In particular, we compare the Russell 1000 index to FTSE RAFI US 1000 index. The Russell 1000 is a well-known index that uses MCW. The FTSE RAFI US 1000 index determines its weights using fundamental data – an approach we discuss further in the Solutions section.
The first period we analyze is the dot-com bubble starting January 1, 1999 through December 31, 2001. As the tech bubble grew from early 1999 to late 2000, the Russell 1000 allocated increasing weights to its high-priced tech constituents. This approach outperformed the FTSE RAFI US 1000 index as it captured much of the momentum during the bubble period. However, by overloading on the overpriced stocks via the MCW, the Russell 1000 set itself up for a tremendous fall. It lost all of its gains and more by December 2001 – ending this period with a net loss. At the same time, the FTSE RAFI US 1000 index did not concentrate its holdings in the overpriced tech sector and gradually achieved a positive return of over 25% during the same two-year period. MCW effectively amounted to a concentrated bet on overpriced techs – overweighting overpriced stocks.
The next example looks at the other side of the coin – underperformance due to systematically underweighting underpriced stocks. In particular, we analyze the FTSE RAFI US 1000 index around the credit crisis. While suffering similar declines as the Russell 1000 from the middle to late 2008 period, the fundamental weighting approach outperformed by over 20% from the depths of the crisis through the end of 2009. Financial services companies turned out to be overpriced before the crisis, but the market reaction during the crisis seemingly punished their prices beyond what was warranted. MCW indices like the Russell 1000 allocated less weight to these companies at the depth of the crisis due to their low prices and thus underperformed significantly during the recovery.
While we discussed specific sectors and time periods in the previous examples, this phenomenon exists all of the time and applies to all stocks in MCW indices. It is also worth noting the fundamental weighting approach does not require we know which companies or sectors are mispriced. It simply assumes some are mispriced and uses fundamental-based weights for all stocks in contrast to MCW indices that naturally allocate higher and lower weights to over- and underpriced stocks, respectively. Accordingly, the MCW issue exists and impacts performance even during normal market periods. While not necessarily as extreme as with our examples, there will always be some mispricing. Now that we highlighted the performance benefits during these extreme periods, our next step is to estimate the impact this systematic misallocation has on performance over the long term.
| Note: It is worth noting the MCW issue is directly related to the value factor. Indeed, some have criticized the fundamental indices as being nothing but another incarnation of the value factor. There is some truth behind these claims. We view fundamental indices as a weak form of value investing; they only address the anti-value tilt (over- and under-weighting of over- and underpriced stocks). Moreover, the weighting differentials between a fundamental index and a MCW index are proportional to value factors. Notwithstanding, there are some key differences that make fundamental indices different.
Standard value investing typically identifies specific stocks as being undervalued and purchases just those shares. Sometimes weights are scaled with the value factor (i.e., they buy more of the cheapest stocks); other times they are equally weighted. The point being value effectively ignores size but the fundamental approach described above (and below) still invests in the broad market and scales weights with size. MCW indices simply use market price information to determine size whereas the weights for fundamental indices are scaled with fundamental data. Another key point distinguishing value-based from fundamental indices is turnover. Value-based approaches typically result in higher turnover as market prices constantly change the valuation factors. However, fundamental indices ignore market prices; they rely only on the fundamental size of a company and this approach results in significantly less turnover. |
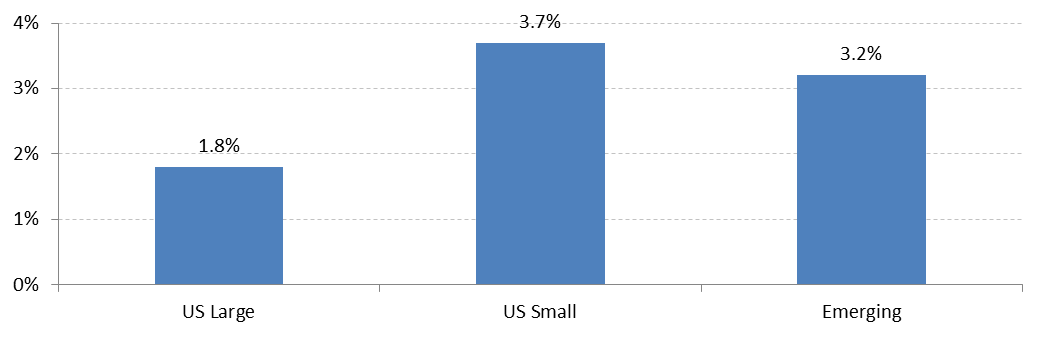
Figure 9: Table MCW impact
 Source: Financial Analysts Journal, Research Affiliates, Russell Indices
Research Affiliates – the firm behind the FTSE RAFI US 1000 index above – has done extensive research evidencing the negative impact on standard MCW indices. They show even with highly looked-over large-cap companies in the US, MCW imposes a performance drag of approximately 1.8% per year[16]. This is significant given the average return over this period was 7.8%. Moreover, Russell Investments shows the MCW performance drag on lesser grazed stock pastures such as small-cap and emerging markets was even greater around 3.0% and 4.0%[17], respectively. The less attention paid to these markets likely resulted in more mispricing and thus more negative impact from MCW weighting as indicated by the higher returns of fundamentally weighted indices.
Solutions
As we discussed above, fundamental indices (i.e., those using fundamental factors such as book value, sales, cash flow, etc. to weight stocks) specifically address the MCW issues. By using information that does not integrate market prices, they avoid the negative impact of mispricing and thus circumvent this issue. In much the same way, equal- and value-weighted indices also avoid the MCW issue.
While these solutions address the MCW issues, they typically involve higher management fees and turnover relative to MCW indices. The higher turnover imposes additional costs – both transactional and tax-related. As such, one must weight these expected costs against the benefits. We find the math clearly favors non-MCW strategies especially in tax-deferred accounts such as IRAs.
We find constructing individual portfolios is the optimal strategy for addressing the MCW issue. This approach allows one to opportunistically manage a passive portfolio to avoid these pitfalls while integrating tax and other considerations off-the-shelf indices and products cannot. Notwithstanding, this approach also involves additional complexity and costs.
While the simplicity, low-turnover and low-cost of MCW indices are great attributes, they come at a significant cost. Any strategy that does not take the market’s word for size will avoid this issue. At the end of the day, each investor will have their own preferences regarding the various flavors of costs, risks, and benefits associated with each of the above solutions. Some investors will prefer to stay closer to the market portfolio while others will pursue more aggressive strategies.
We are agnostic about staying close to the market portfolio because we know the market is often wrong. Our goal is performance: opportunistically targeting higher returns and lower volatility. While we look at performance net of costs (taxes, transactional, etc) and lean toward those strategies where the benefits most outweigh the costs, these are just numbers. Each additional degree of effort or complexity must be considered relative to the investor perspective. Some may prefer to go the extra mile for several basis points of performance while others may tolerate a percentage point or more in performance-related costs to stay married to the low fees.
Index Issue #4: Dis-economic Index Strategies & Rules
Following the momentum of index-based strategies, the financial industry has created a seemingly endless array of indices to suit investors of all types. However, we find that many of these products favor advisors over investors. In particular, many of the products are constructed with marketability rather than performance in mind. When one looks deeper into the products and related strategies, this conflict of interest becomes more visible. While we are the first to acknowledge marketability is important for any business, we do not believe it should come at the cost of significantly diminished performance for the end-users: investors. Judging by the types of products and strategies advocated by the financial services industry, this is precisely what is happening.
In a nutshell, the industry has created a vast array of index-based products and encouraged advisors to pursue what we call the condiment approach to investing. After digesting clients’ goals and risk profiles, advisors produce portfolios of ETFs with a dash of this and a dash of that. In this case, the dashes of flavors have labels like value, growth, big, small, quality, etc.
So what is wrong with this approach? We will focus on what we believe to be the three biggest flaws in this approach. The first has to do with logical diversification. In the course of analyzing portfolios for prospective clients or seeing other firms’ model portfolios, we often come across allocations where a lack of common sense becomes readily apparent. For example, we will see a dash of large-cap, a dash of mid-cap, and a dash of small-cap all in one portfolio – presumably for the purpose of diversification. However, this diversification is illusory and imposes unnecessary costs.
These allocations effectively add up to the market portfolio. In other words, the advisor carved up what could have been an ultra-low fee total market fund into three different funds with higher fees. With Vanguard, this would have almost doubled the management fees from four to nine basis points. While the absolute level of Vanguard’s fees is low, the impact is generally higher with other fund companies and different factors used to divide the market portfolio (e.g., growth and value). Moreover, transactional and front-running costs are higher for the three smaller funds than the total market fund. No matter how big or small the impact, it is negative and the lack of common sense funnels money from investors to fund companies.
The second issue with the condiment approach is the ingredients. Many of the ETFs and other products embed dis-economic logic into their construction. The best example is probably growth indices. What types of companies would be in a growth index? The easy and sensible answer would be companies that are growing. However, some of the largest and most well-known index providers impose additional rules for growth companies whereby they systematically screen out any growth companies trading at favorable valuations. They do this make value and growth mutually exclusive categories. The same is true for value companies; those with higher growth are systematically removed.
| “Market commentators and investment managers who glibly refer to ‘growth’ and ‘value’ styles as contrasting approaches to investment are displaying their ignorance, not their sophistication.”
– Warren Buffett (Berkshire’s 2000 letter to shareholders) |
By defining growth as being not value, they have seemingly compromised performance (recall we discussed how the value factor correlates to higher returns in the first section) for the higher purpose of conforming to the more marketable condiment model of investing. Maintaining mutually exclusive growth and value definitions may make it easier for advisors to create the appearance of diversification, but these constructions impose additional performance-related costs, but as Warren Buffet says, “growth and value are tied at the hip”[18]. The advisors advocating such strategies are either ignoring or unaware of these issues. Absurd as this may seem, there are billions of dollars tracking these growth indices.
The third dis-economic issue we highlight here also relates to carving up the broader market via various factors. In particular, most indices focus on a single factor and this narrow focus constrains the types of portfolios investors can construct. For example, it would be reasonable for an investor to desire a portfolio of high quality companies trading at attractive valuations – recall from the very first issue we highlighted the synergy achieved by combining value and quality. In other words, investors may like to impose both quality and value factors. However, the condiment approach - based on individual flavors – does not allow for this. Instead, investors are forced to choose this factor or that factor for each allocation and must invest in value and quality via separate allocations. Some may claim diversification benefits, but it really just opens the door for other risks in these allocations (paying too much or investing in low quality companies).
Figure 10: Constraint imposed by individual factor model
Source: Aaron Brask Capital
On balance, index investing is a welcome alternative to actively managed mutual funds with higher costs. However, in an effort to populate the shelves of the investment supermarket and propagate the condiment approach to investing, the financial services industry has significantly compromised performance to increase marketability. We estimate these dis-economic index rules and strategies can cost investors between 0-3% per year in returns depending on the types of products and strategies they employ. Unfortunately, the major index and related product providers have no interest in shedding light on these issues. This should be no surprise given their profit motive. However, the academic community has been slow to recognize or address these issues as well. While their focus may not be linked so directly to profit, it is clear the condiment approach has spawned an enormous amount of academic content and theory, just as the now-outdated capital asset pricing model (CAPM) provided the foundation for several decades of theory and analysis.
Solutions
There are many ways to avoid the issues above. The best way is to conduct due diligence on each index you are considering for investment and only use those with sensible logic. This will help avoid the dis-economic rules. An easier way might be to simply stick to the broad market indices (thus avoiding the fancy flavors that give rise to these problems). Should one go this route, it is important to avoid using smaller sectors of the market that add up to the total market (e.g., large + mid + small cap or growth + value funds).
Building and maintaining portfolios of individual securities can avoid all of these dis-economic indices and strategies. It can also open the door to increased personalization. This can include the use of multiple factors (e.g., quality and value) existing indices and ETFs do not offer. Moreover, one can set the bar as high or as low as they like for various factors. For example, wealthy clients often prioritize preservation and income over growth. This can be achieved by imposing a higher bar for quality to mitigate business risk. We like to target robust, non-cyclical companies as they tend to minimize both business risk and market volatility. Income goals can also be targeted by focusing only on those high quality companies that pay and increase their dividends (note: this can be redundant in the sense that this requirement can be used to determine the quality of a company).
Executive Summary and Conclusion
|
At the risk of sounding like a broken record, we think very highly of index investing – especially when the alternative is actively managed mutual funds. However, index investing is not without flaws. We believe there are simple ways to avoid or mitigate the issues we have highlighted in this article. You can choose index products that minimize these issues or formulate and manage your own passive portfolios of individual securities to avoid them altogether. It is ultimately a matter of personal preference. Our role is simply to make our clients fully aware of all the angles – good and bad – before making their investment decisions.
We happily accommodate investors who favor index products such as ETFs by helping them select those which minimize the above issues and constructing sensible portfolios to target their goals and risk profile. However, as readers may have gathered from the solutions we recommended above, we generally advocate investing directly in the market via portfolios of individual securities based on sensible rules (we call these personalized index portfolios). This approach not only allows us to avoid the above issues highlighted in this article, but it also allows for better targeting of client goals and risk profiles. Moreover, this strategy can avoid paying two layers of fees[19]. Indeed, many advisors charge a fee for their advice and then place your money with other funds or mangers that charge an additional fee. While we tend to focus on the numbers (e.g., performance and fees), we often find the greater flexibility and personalization is what clients find to be the most attractive feature of our direct investment approach.
To be clear, the performance-related costs we discussed are not necessarily independent or additive. For example, the performance drag from dis-economic index construction and MCW are directly related to the value factor. In other words, some of these issues are redundant. After accounting for these redundancies, we estimate the total impact is typically in the 1.5-2.5% range but sometimes higher or lower.
The strategies we propose to mitigate and avoid these issues are not without risk. It is extremely important to find managers who can execute these strategies in a sensible fashion and optimize performance in a manner that is consistent with each client’s goals and risk profile. One must always consider the implementation costs. These will include direct costs in the form of higher fees but also any additional taxes a strategy might impose (i.e., higher turnover strategies will lead to more capital gains taxes in taxable portfolios than a standard broad market index with low turnover).
About Aaron Brask CapitalMany financial companies make the claim, but our firm is truly different – both in structure and spirit. We are structured as an independent, fee-only registered investment advisor. That means we do not promote any particular products and cannot receive commissions from third parties. In addition to holding us to a fiduciary standard, this structure further removes monetary conflicts of interests and aligns our interests with those of our clients. In terms of spirit, Aaron Brask Capital embodies the ethics, discipline, and expertise of its founder, Aaron Brask. In particular, his analytical background and experience working with some of the most affluent families around the globe have been critical in helping him formulate investment strategies that deliver performance and comfort to his clients. We continually strive to demonstrate our loyalty and value to our clients so they know their financial affairs are being handled with the care and expertise they deserve. |
Disclaimer
|
- This quote is an English translation of an excerpt from Baudelaire’s collection of poems Paris Spleen (1851). The original French text was: “La plus belle des ruses du diable est de vous persuader qu'il n'existe pas." ↑
- Grantham Mayo van Otterloo (GMO) is a highly respected research and investment firm. Their June 2012 paper was titled “Profits for the Long Run: Affirming the Case for Quality”. ↑
- Results from the 2013 book Quantitative Value: A Practitioner’s Guide to Automating Intelligent Investment and Eliminating Behavioral Errors written by Wesley Gray, PhD and Tobias Carlisle, LLB. ↑
- They presented their results for returns as arithmetic averages so we can only estimate the annualized figure without knowing how the monthly returns compounded. ↑
- Greenblatt achieved tremendous annualized returns of greater than 40% in his Gotham Partners hedge fund from 1986 to 1995. He currently runs several long/short mutual funds that follow his quality/value strategy. ↑
- The Little Book that Beats the Market (2005), The Little Book that Still Beats the Market (2010), and the Big Secret for the Small Investor (2011). ↑
- There were 500 companies starting in year one and then 150 (30% x 500) new companies in each of the next 9 years for a total of 1,850 (500 + 9 x 150). ↑
- $1,000,000 portfolio with commissions of $10 per trade, bid/ask spreads of 0.25%, and 40% capital gains on 100% of the gains each year. ↑
- We do not like the arbitrage label since it implies riskless profits ↑
- [Market] capitalization refers to the total value of a company as indicated by its current share price. In other words, it is the number of shares outstanding multiplied by its current price. ↑
- https://www.wintoncapital.com/assets/Documents/WWP_HiddenCosts_final_revised.pdf ↑
- http://www.petajisto.net/papers/petajisto%202011%20jef%20-%20hidden%20cost%20for%20index%20funds.pdf ↑
- http://aaronbraskcapital.com/sites/default/files/A%20brief%20history%20of%20indexation.pdf ↑
- We explain market capitalization weighting in the next section. ↑
- Market capitalization is simply the current stock price multiplied the number of shares outstanding. In other words, it is the cost of purchasing the entire company at the current stock price. ↑
- http://www.researchaffiliates.com/Production%20content%20library/FAJ_Mar_Apr_2005_Fundamental_Indexation.pdf ↑
- http://www.russell.com/documents/indexes/research/benefits-of-fundamentally-weighted-indexes-in-less-efficient-markets.pdf and http://www.researchaffiliates.com/Our%20Ideas/Insights/Fundamentals/Pages/F_2008_April_Indexing_in_Inefficient_Markets.aspx ↑
- Source: Berkshire’s 1992 Chairman’s Letter ↑
- Aaron Brask Capital can invest directly in the market and bypass funds and third-party managers – effectively integrating the investment advisory and investment management roles. ↑